| Red River Wildlife Management Area | |
|---|---|
IUCN category IV (habitat/species management area) | |
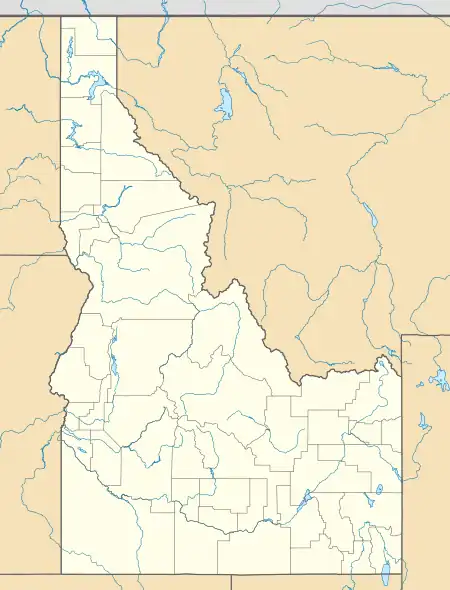 | |
| Location | Idaho County, Idaho, United States |
| Nearest city | Elk City, ID |
| Coordinates | 45°43′45″N 115°25′49″W / 45.729043°N 115.430234°W |
| Area | 314 acres (1.3 km2) |
| Established | September 1993 |
| Governing body | Idaho Department of Fish and Game |
| fishandgame | |
Red River Wildlife Management Area at 314 acres (1.27 km2) is an Idaho wildlife management area in Idaho County near Elk City.[1] It was purchased in 1993 from Don Wilkerson who offered it to the state to preserve it in a natural, undeveloped state.[2] The property was acquired with the donations of $100,00 from the Rocky Mountain Elk Foundation, $100,000 from Trout Unlimited, and $287,000 in mitigation funds from the Bonneville Power Administration.
The WMA includes a meadow near the South Fork of the Clearwater River.[3] White-tailed deer, moose, and elk are often found in the meadow.[4]
Climate
The weather station for the Red River Ranger Station is nearby.[5][6] Red River has a humid continental climate (Köppen Dfb), bordering on a subalpine climate (Köppen Dfc).
| Climate data for Red River RS, Idaho, 1991–2020 normals, 1998-2020 records: 4350ft (1326m) | |||||||||||||
|---|---|---|---|---|---|---|---|---|---|---|---|---|---|
| Month | Jan | Feb | Mar | Apr | May | Jun | Jul | Aug | Sep | Oct | Nov | Dec | Year |
| Record high °F (°C) | 56 (13) |
56 (13) |
68 (20) |
79 (26) |
87 (31) |
95 (35) |
104 (40) |
98 (37) |
98 (37) |
87 (31) |
70 (21) |
54 (12) |
104 (40) |
| Mean maximum °F (°C) | 48.2 (9.0) |
51.1 (10.6) |
60.9 (16.1) |
72.7 (22.6) |
80.4 (26.9) |
86.7 (30.4) |
95.0 (35.0) |
93.5 (34.2) |
88.8 (31.6) |
78.3 (25.7) |
59.6 (15.3) |
46.2 (7.9) |
93.0 (33.9) |
| Mean daily maximum °F (°C) | 34.9 (1.6) |
38.5 (3.6) |
46.4 (8.0) |
52.8 (11.6) |
61.4 (16.3) |
70.2 (21.2) |
79.8 (26.6) |
80.1 (26.7) |
72.9 (22.7) |
55.8 (13.2) |
41.8 (5.4) |
32.8 (0.4) |
55.6 (13.1) |
| Daily mean °F (°C) | 25.1 (−3.8) |
27.6 (−2.4) |
33.5 (0.8) |
39.2 (4.0) |
47.1 (8.4) |
54.5 (12.5) |
60.8 (16.0) |
59.5 (15.3) |
53.1 (11.7) |
41.4 (5.2) |
31.2 (−0.4) |
23.7 (−4.6) |
41.4 (5.2) |
| Mean daily minimum °F (°C) | 15.3 (−9.3) |
16.8 (−8.4) |
20.5 (−6.4) |
25.7 (−3.5) |
32.8 (0.4) |
38.9 (3.8) |
41.8 (5.4) |
38.9 (3.8) |
33.3 (0.7) |
27.0 (−2.8) |
20.5 (−6.4) |
14.6 (−9.7) |
27.2 (−2.7) |
| Mean minimum °F (°C) | −7.5 (−21.9) |
−1.2 (−18.4) |
2.8 (−16.2) |
14.6 (−9.7) |
21.5 (−5.8) |
29.1 (−1.6) |
33.0 (0.6) |
29.5 (−1.4) |
23.3 (−4.8) |
11.7 (−11.3) |
3.3 (−15.9) |
−4.5 (−20.3) |
−13.5 (−25.3) |
| Record low °F (°C) | −20 (−29) |
−14 (−26) |
−8 (−22) |
3 (−16) |
16 (−9) |
26 (−3) |
28 (−2) |
25 (−4) |
15 (−9) |
−4 (−20) |
−15 (−26) |
−19 (−28) |
−20 (−29) |
| Average precipitation inches (mm) | 2.13 (54) |
1.80 (46) |
2.70 (69) |
3.04 (77) |
3.26 (83) |
2.56 (65) |
1.49 (38) |
1.06 (27) |
1.49 (38) |
2.00 (51) |
2.53 (64) |
2.22 (56) |
26.28 (668) |
| Average snowfall inches (cm) | 21.4 (54) |
14.9 (38) |
19.1 (49) |
14.2 (36) |
2.2 (5.6) |
0.5 (1.3) |
0.0 (0.0) |
0.0 (0.0) |
0.1 (0.25) |
1.7 (4.3) |
13.2 (34) |
21.1 (54) |
108.4 (276.45) |
| Source 1: NOAA (1981-2010 precipitation)[7][8] | |||||||||||||
| Source 2: XMACIS2 (records, monthly max/mins & 1998-2010 snow)[9] | |||||||||||||
Mountain Meadows is a SNOTEL weather station located near Red River Wildlife Management Area at an elevation of 6360 ft (1939 m).[10] Mountain Meadows has a subalpine climate (Köppen Dfc).
| Climate data for Mountain Meadows, Idaho, 1991–2020 normals, 1989-2020 extremes: 6360ft (1939m) | |||||||||||||
|---|---|---|---|---|---|---|---|---|---|---|---|---|---|
| Month | Jan | Feb | Mar | Apr | May | Jun | Jul | Aug | Sep | Oct | Nov | Dec | Year |
| Record high °F (°C) | 60 (16) |
63 (17) |
65 (18) |
73 (23) |
82 (28) |
90 (32) |
93 (34) |
91 (33) |
86 (30) |
80 (27) |
65 (18) |
53 (12) |
93 (34) |
| Mean maximum °F (°C) | 48.5 (9.2) |
52.3 (11.3) |
58.5 (14.7) |
65.2 (18.4) |
72.5 (22.5) |
80.0 (26.7) |
85.4 (29.7) |
84.0 (28.9) |
79.7 (26.5) |
69.1 (20.6) |
55.4 (13.0) |
46.8 (8.2) |
86.5 (30.3) |
| Mean daily maximum °F (°C) | 34.1 (1.2) |
37.0 (2.8) |
42.6 (5.9) |
47.5 (8.6) |
55.7 (13.2) |
62.5 (16.9) |
73.6 (23.1) |
72.9 (22.7) |
63.8 (17.7) |
49.9 (9.9) |
38.7 (3.7) |
32.5 (0.3) |
50.9 (10.5) |
| Daily mean °F (°C) | 22.9 (−5.1) |
24.3 (−4.3) |
28.9 (−1.7) |
33.9 (1.1) |
41.6 (5.3) |
47.7 (8.7) |
55.3 (12.9) |
54.1 (12.3) |
47.2 (8.4) |
36.9 (2.7) |
27.6 (−2.4) |
21.7 (−5.7) |
36.8 (2.7) |
| Mean daily minimum °F (°C) | 11.5 (−11.4) |
11.5 (−11.4) |
15.1 (−9.4) |
20.3 (−6.5) |
27.3 (−2.6) |
33.0 (0.6) |
36.9 (2.7) |
35.3 (1.8) |
30.4 (−0.9) |
24.1 (−4.4) |
16.6 (−8.6) |
11.0 (−11.7) |
22.8 (−5.1) |
| Mean minimum °F (°C) | −14.8 (−26.0) |
−13.5 (−25.3) |
−6.8 (−21.6) |
1.7 (−16.8) |
13.7 (−10.2) |
24.0 (−4.4) |
28.3 (−2.1) |
26.7 (−2.9) |
19.4 (−7.0) |
6.2 (−14.3) |
−7.5 (−21.9) |
−14.2 (−25.7) |
−22.3 (−30.2) |
| Record low °F (°C) | −32 (−36) |
−29 (−34) |
−18 (−28) |
−9 (−23) |
1 (−17) |
10 (−12) |
24 (−4) |
17 (−8) |
5 (−15) |
−17 (−27) |
−29 (−34) |
−40 (−40) |
−40 (−40) |
| Average precipitation inches (mm) | 4.66 (118) |
4.12 (105) |
5.06 (129) |
5.52 (140) |
4.82 (122) |
4.19 (106) |
1.41 (36) |
1.15 (29) |
2.10 (53) |
3.40 (86) |
4.77 (121) |
4.79 (122) |
45.99 (1,167) |
| Average extreme snow depth inches (cm) | 53.9 (137) |
65.7 (167) |
73.2 (186) |
70.7 (180) |
51.1 (130) |
11.1 (28) |
0.4 (1.0) |
0.0 (0.0) |
1.4 (3.6) |
7.7 (20) |
20.9 (53) |
39.9 (101) |
74.1 (188) |
| Source 1: XMACIS2(normals, records & 2000-2020 snow depth)[11] | |||||||||||||
| Source 2: NOAA (precipitation)[12] | |||||||||||||
References
- ↑ "Red River Wildlife Management Area". Idaho Department of Fish and Game. Archived from the original on September 19, 2015. Retrieved May 29, 2012.
- ↑ White, Jim (July 1999). "Red River Wildlife Management Area Management Plan" (PDF). Idaho Department of Fish and Game. Archived (PDF) from the original on May 12, 2012. Retrieved May 29, 2012.
- ↑ "Red River Wildlife Management Area". Public Lands Information Center. Archived from the original on February 21, 2013. Retrieved May 29, 2012.
- ↑ "Wildlife Management Areas". Idaho Department of Fish and Game. Archived from the original on March 2, 2013. Retrieved May 29, 2012.
- ↑ "Data of Meteorological Station Red River Rs, Idaho". geographic.org. Retrieved January 9, 2024.
- ↑ "Red River Ranger Station". USDA Forest Service. Retrieved January 9, 2024.
- ↑ "Red River RS, Idaho 1991-2020 Monthly Normals". Retrieved January 9, 2024.
- ↑ "Red River RS, Idaho 1981-2010 Monthly Normals". Retrieved January 9, 2024.
- ↑ "xmACIS". National Oceanic and Atmospheric Administration. Retrieved January 9, 2024.
- ↑ "Data of Meteorological Station Mountain Meadows, Idaho". geographic.org. Retrieved January 9, 2024.
- ↑ "xmACIS2". National Oceanic and Atmospheric Administration. Retrieved January 9, 2024.
- ↑ "Mountain Meadows, Idaho 1991-2020 Monthly Normals". Retrieved January 9, 2024.