| STC rapid transit | |||||||||||
 | |||||||||||
| General information | |||||||||||
| Location | Avenida Ribera de San Cosme Miguel Hidalgo Mexico City Mexico | ||||||||||
| Coordinates | 19°26′30″N 99°09′40″W / 19.441706°N 99.161096°W | ||||||||||
| Line(s) | |||||||||||
| Platforms | 2 side platforms | ||||||||||
| Tracks | 2 | ||||||||||
| Construction | |||||||||||
| Structure type | Underground | ||||||||||
| History | |||||||||||
| Opened | 14 September 1970 | ||||||||||
| Passengers | |||||||||||
| 2022 | 5,704,555[1] | ||||||||||
| Rank | 70/195[1] | ||||||||||
| Services | |||||||||||
| |||||||||||
| Location | |||||||||||
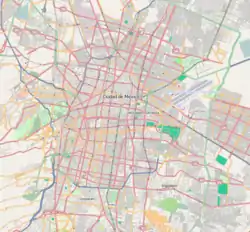
 Location within Mexico City | |||||||||||
| Area map | |||||||||||
San Cosme is a station on Line 2 of the Mexico City Metro system.[2][3] It is located in the Cuauhtémoc municipality of Mexico City, northwest of the city centre, on Avenue Ribera de San Cosme a few blocks before it becomes Calzada México-Tacuba.[2] The southern exit leads to Colonia San Rafael while the Northern one leads to Colonia Santa María la Ribera.[2] It is two blocks from the Mercado de San Cosme. In 2019, the station had an average ridership of 22,891 passengers per day.[4]
Name and pictogram
The station name comes from the Ribera de San Cosme avenue, on which the station is located. The former name of the road was Calzada de San Cosme and a stream used to run along the way before the desiccation of Lake Texcoco, hence the name "ribera".[2][5]
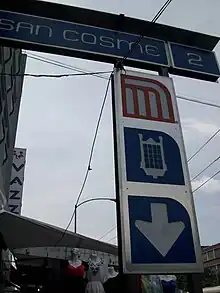
The station pictogram depicts a balcony from the nearby colonial building known as La Casa de los Mascarones that currently houses the National Autonomous University of Mexico Foreign Languages School.[2][3]
General information
The station was opened on 14 September 1970 as part of the second stretch of Line 2, from Pino Suárez to Tacuba.[6]
The station serves the Colonia San Rafael and Colonia Santa María la Ribera neighborhoods.
Ridership
| Annual passenger ridership | |||||
|---|---|---|---|---|---|
| Year | Ridership | Average daily | Rank | % change | Ref. |
| 2022 | 5,704,555 | 15,628 | 70/195 | +67.42% | [1] |
| 2021 | 3,407,301 | 9,335 | 92/195 | −21.03% | [7] |
| 2020 | 4,314,737 | 11,788 | 82/195 | −48.36% | [8] |
| 2019 | 8,355,454 | 22,891 | 66/195 | +1.14% | [4] |
| 2018 | 8,261,419 | 22,634 | 72/195 | −4.99% | [9] |
| 2017 | 8,694,990 | 23,821 | 62/195 | −7.68% | [10] |
| 2016 | 9,417,922 | 25,732 | 55/195 | −10.08% | [11] |
| 2015 | 10,473,114 | 28,693 | 48/195 | −2.39% | [12] |
| 2014 | 10,729,878 | 29,396 | 46/195 | +4.59% | [13] |
| 2013 | 10,387,074 | 28,457 | 53/195 | +3.79% | [14] |
| 2012 | 9,883,935 | 27,005 | 56/195 | −14.51% | [15] |
| 2011 | 11,561,780 | 31,676 | 46/175 | +55.08% | [16] |
| 2010 | 7,455,453 | 20,425 | 73/175 | – | [17] |
Exits
- North: Avenida Ribera de San Cosme and Rosas Moreno street, Colonia San Rafael
- South: Avenida Ribera de San Cosme and Naranjo street, Colonia Santa María la Ribera
Gallery
 Detail of the Casa de los Mascarones balcony
See also
References
- 1 2 3 "Afluencia de estación por línea 2022" [Station traffic per line 2022] (in Spanish). Sistema Transporte Colectivo Metro. 2023. Archived from the original on 5 March 2023. Retrieved 5 March 2023.
- 1 2 3 4 5 "San Cosme" (in Spanish). Archived from the original on 28 January 2012. Retrieved 14 August 2011.
- 1 2 Archambault, Richard. "San Cosme » Mexico City Metro System". Retrieved 14 August 2011.
- 1 2 "Afluencia de estación por línea 2019" [Station traffic per line 2019] (in Spanish). Sistema Transporte Colectivo Metro. 2020. Archived from the original on 8 April 2020. Retrieved 3 May 2020.
- ↑ "San Cosme" (in Spanish). Metro CDMX. Retrieved 11 May 2020.
- ↑ Monroy, Marco. Schwandl, Robert (ed.). "Opening Dates for Mexico City's Subway". Retrieved 14 August 2011.
- ↑ "Afluencia de estación por línea 2021" [Station traffic per line 2021] (in Spanish). Sistema Transporte Colectivo Metro. 2022. Archived from the original on 7 March 2022. Retrieved 7 March 2022.
- ↑ "Afluencia de estación por línea 2020" [Station traffic per line 2020] (in Spanish). Sistema Transporte Colectivo Metro. 2021. Archived from the original on 21 June 2021. Retrieved 21 June 2021.
- ↑ "Afluencia de estación por línea 2018" [Station traffic per line 2018] (in Spanish). Sistema Transporte Colectivo Metro. 2019. Archived from the original on 6 June 2019. Retrieved 7 April 2020.
- ↑ "Afluencia de estación por línea 2017" [Station traffic per line 2017] (in Spanish). Sistema Transporte Colectivo Metro. 2019. Archived from the original on 3 May 2020. Retrieved 3 May 2020.
- ↑ "Afluencia de estación por línea 2016" [Station traffic per line 2016] (in Spanish). Sistema Transporte Colectivo Metro. 2017. Archived from the original on 3 May 2020. Retrieved 3 May 2020.
- ↑ "Afluencia de estación por línea 2015" [Station traffic per line 2015] (in Spanish). Sistema Transporte Colectivo Metro. 2016. Archived from the original on 3 May 2020. Retrieved 6 May 2020.
- ↑ "Afluencia de estación por línea 2014" [Station traffic per line 2014] (in Spanish). Sistema Transporte Colectivo Metro. 2015. Archived from the original on 3 May 2020. Retrieved 6 May 2020.
- ↑ "Afluencia de estación por línea 2013" [Station traffic per line 2013] (in Spanish). Sistema Transporte Colectivo Metro. 2014. Archived from the original on 3 May 2020. Retrieved 6 May 2020.
- ↑ "Afluencia de estación por línea 2012" [Station traffic per line 2012] (in Spanish). Sistema Transporte Colectivo Metro. 2013. Archived from the original on 3 May 2020. Retrieved 6 May 2020.
- ↑ "Afluencia de estación por línea 2011" [Station traffic per line 2011] (in Spanish). Sistema Transporte Colectivo Metro. 2012. Archived from the original on 7 May 2020. Retrieved 6 May 2020.
- ↑ "Afluencia de estación por línea 2010" [Station traffic per line 2010] (in Spanish). Sistema Transporte Colectivo Metro. 2011. Archived from the original on 7 May 2020. Retrieved 6 May 2020.