Santa Victoria Este | |
|---|---|
City | |
.jpg.webp) Santa Victoria Este, Argentina | |
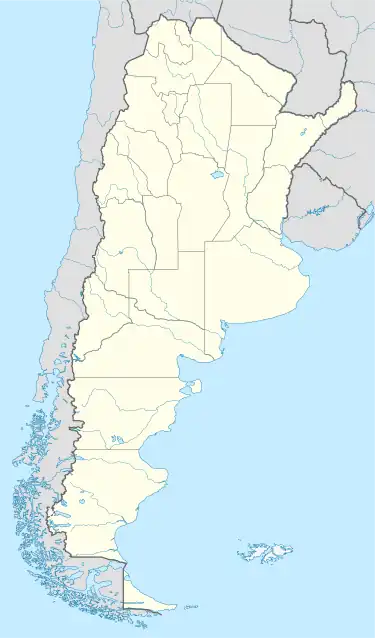 Santa Victoria Este Location in Argentina | |
| Coordinates: 22°16′30″S 62°42′50″W / 22.27500°S 62.71389°W | |
| Country | |
| Province | |
| Population | |
| • Total | 1,283 |
Santa Victoria Este is an Argentine town in northeastern Salta Province in the Department of Rivadavia. According to the 2010 Census, it has a population of 1,283.[1]
Climate
| Climate data for Santa Victoria Este (Temperature normals and records: 1993–2018; Precipitation normals: 1981-2010) | |||||||||||||
|---|---|---|---|---|---|---|---|---|---|---|---|---|---|
| Month | Jan | Feb | Mar | Apr | May | Jun | Jul | Aug | Sep | Oct | Nov | Dec | Year |
| Record high °C (°F) | 45.0 (113.0) |
45.0 (113.0) |
43.5 (110.3) |
40.5 (104.9) |
38.5 (101.3) |
37.0 (98.6) |
39.0 (102.2) |
43.0 (109.4) |
44.5 (112.1) |
46.4 (115.5) |
45.8 (114.4) |
45.0 (113.0) |
46.4 (115.5) |
| Mean daily maximum °C (°F) | 36.1 (97.0) |
34.6 (94.3) |
32.9 (91.2) |
29.6 (85.3) |
26.1 (79.0) |
24.1 (75.4) |
25.1 (77.2) |
28.7 (83.7) |
31.6 (88.9) |
33.9 (93.0) |
35.1 (95.2) |
35.7 (96.3) |
31.1 (88.0) |
| Daily mean °C (°F) | 28.9 (84.0) |
27.8 (82.0) |
26.2 (79.2) |
23.3 (73.9) |
19.7 (67.5) |
17.6 (63.7) |
17.5 (63.5) |
20.6 (69.1) |
23.5 (74.3) |
26.5 (79.7) |
27.8 (82.0) |
28.6 (83.5) |
24.0 (75.2) |
| Mean daily minimum °C (°F) | 22.3 (72.1) |
21.8 (71.2) |
20.5 (68.9) |
18.1 (64.6) |
14.4 (57.9) |
12.1 (53.8) |
10.9 (51.6) |
13.2 (55.8) |
15.9 (60.6) |
19.7 (67.5) |
20.9 (69.6) |
22.1 (71.8) |
17.7 (63.9) |
| Record low °C (°F) | 12.6 (54.7) |
11.5 (52.7) |
11.4 (52.5) |
3.5 (38.3) |
3.0 (37.4) |
−1.0 (30.2) |
−4.0 (24.8) |
−2.0 (28.4) |
2.0 (35.6) |
8.0 (46.4) |
10.0 (50.0) |
10.6 (51.1) |
−4.0 (24.8) |
| Average precipitation mm (inches) | 120.6 (4.75) |
109.1 (4.30) |
114.1 (4.49) |
57.8 (2.28) |
21.1 (0.83) |
7.0 (0.28) |
3.4 (0.13) |
3.0 (0.12) |
10.5 (0.41) |
35.9 (1.41) |
87.0 (3.43) |
105.2 (4.14) |
674.7 (26.56) |
| Source: Red Hidrológica Nacional[2] | |||||||||||||
References
- ↑ Ministerio del Interior (in Spanish)
- ↑ "Base de Datos Hidrológica Integrada" (in Spanish). Secretaría de Infraestructura y Política Hídrica. Retrieved March 13, 2018.
This article is issued from Wikipedia. The text is licensed under Creative Commons - Attribution - Sharealike. Additional terms may apply for the media files.