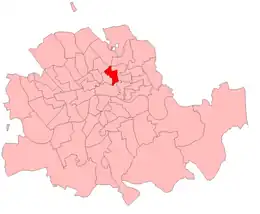
| Hoxton | |
|---|---|
| Former Borough constituency for the House of Commons | |
| 1885–1918 | |
| Seats | one |
| Created from | Hackney |
| Replaced by | Shoreditch |
Hoxton was a borough constituency centred on the Hoxton district of London. It returned one Member of Parliament (MP) to the House of Commons of the Parliament of the United Kingdom, elected by the first past the post system.
History

The constituency was created by the Redistribution of Seats Act 1885 for the 1885 general election, and abolished for the 1918 general election.
Boundaries

The constituency was created in 1885, as a division of the parliamentary borough of Shoreditch in the East End of London. The area was administered as part of the Tower division of the county of Middlesex.
The division consisted of the Church, Hoxton, Moorfields and Wenlock wards.
In 1889 there were administrative changes. The territory of the constituency was severed from Middlesex and included in the new County of London. The lower tier of local government in the area continued to be administered by parish vestries and local boards of works.
In 1900 local government in London was rationalised. The civil parish of St. Leonard, Shoreditch became part of a larger Metropolitan Borough of Shoreditch.
In the redistribution of parliamentary seats in 1918, the Metropolitan Borough of Shoreditch constituted a single parliamentary division of Shoreditch. The Hoxton division was abolished.
Members of Parliament
| Election | Member | Party | |
|---|---|---|---|
| 1885 | James Stuart | Liberal | |
| 1900 | Claude Hay | Conservative | |
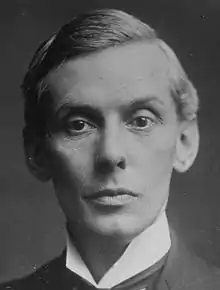
| 1910 | Christopher Addison | Liberal | |
| 1918 | constituency abolished | ||
Election results
Elections in the 1880s
| Party | Candidate | Votes | % | ±% | |
|---|---|---|---|---|---|
| Liberal | James Stuart | 3,084 | 60.1 | ||
| Conservative | Robert Arthur Germaine | 2,047 | 39.9 | ||
| Majority | 1,037 | 20.2 | |||
| Turnout | 5,131 | 60.6 | |||
| Registered electors | 8,469 | ||||
| Liberal win (new seat) | |||||
| Party | Candidate | Votes | % | ±% | |
|---|---|---|---|---|---|
| Liberal | James Stuart | 2,324 | 52.8 | −7.3 | |
| Conservative | Robert Arthur Germaine | 2,079 | 47.2 | +7.3 | |
| Majority | 245 | 5.6 | −14.6 | ||
| Turnout | 4,403 | 52.0 | −8.6 | ||
| Registered electors | 8,469 | ||||
| Liberal hold | Swing | -7.3 | |||
Elections in the 1890s
| Party | Candidate | Votes | % | ±% | |
|---|---|---|---|---|---|
| Liberal | James Stuart | 3,410 | 61.6 | +8.8 | |
| Conservative | Claude Hay | 2,114 | 38.1 | −9.1 | |
| Labour Union | Alexander Karley Donald | 19 | 0.3 | New | |
| Majority | 1,296 | 23.5 | +17.9 | ||
| Turnout | 5,543 | 69.2 | +17.2 | ||
| Registered electors | 8,011 | ||||
| Liberal hold | Swing | +9.0 | |||

| Party | Candidate | Votes | % | ±% | |
|---|---|---|---|---|---|
| Liberal | James Stuart | 2,990 | 51.1 | −10.5 | |
| Conservative | Claude Hay | 2,862 | 48.9 | +10.8 | |
| Majority | 128 | 2.2 | −21.3 | ||
| Turnout | 5,852 | 66.6 | −2.6 | ||
| Registered electors | 8,789 | ||||
| Liberal hold | Swing | −10.7 | |||
Elections in the 1900s
| Party | Candidate | Votes | % | ±% | |
|---|---|---|---|---|---|
| Conservative | Claude Hay | 2,866 | 52.5 | +3.6 | |
| Liberal | James Stuart | 2,595 | 47.5 | −3.6 | |
| Majority | 271 | 5.0 | N/A | ||
| Turnout | 5,461 | 70.1 | +3.5 | ||
| Registered electors | 7,789 | ||||
| Conservative gain from Liberal | Swing | +3.6 | |||

| Party | Candidate | Votes | % | ±% | |
|---|---|---|---|---|---|
| Conservative | Claude Hay | 3,489 | 55.9 | +3.4 | |
| Liberal | Henry Ward | 2,753 | 44.1 | −3.4 | |
| Majority | 736 | 11.8 | +6.8 | ||
| Turnout | 6,242 | 80.5 | +10.4 | ||
| Registered electors | 7,754 | ||||
| Conservative hold | Swing | +3.4 | |||
Elections in the 1910s

| Party | Candidate | Votes | % | ±% | |
|---|---|---|---|---|---|
| Liberal | Christopher Addison | 3,736 | 52.4 | +8.3 | |
| Conservative | Claude Hay | 3,398 | 47.6 | −8.3 | |
| Majority | 338 | 4.8 | N/A | ||
| Turnout | 7,134 | 83.6 | +3.1 | ||
| Registered electors | 8,530 | ||||
| Liberal gain from Conservative | Swing | +8.3 | |||
| Party | Candidate | Votes | % | ±% | |
|---|---|---|---|---|---|
| Liberal | Christopher Addison | 3,489 | 55.5 | +3.1 | |
| Conservative | Francis Francis | 2,795 | 44.5 | −3.1 | |
| Majority | 694 | 11.0 | +6.2 | ||
| Turnout | 6,284 | 73.7 | −9.9 | ||
| Registered electors | 8,530 | ||||
| Liberal hold | Swing | +3.1 | |||