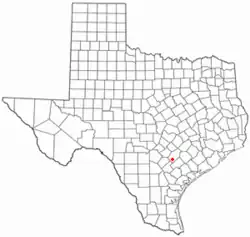
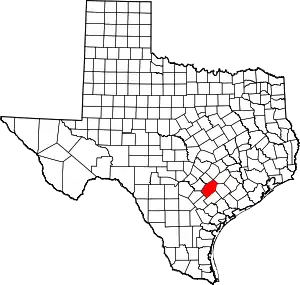
Smiley, Texas | |
|---|---|
 Location of Smiley, Texas | |
 | |
| Coordinates: 29°16′10″N 97°38′13″W / 29.26944°N 97.63694°W | |
| Country | United States |
| State | Texas |
| County | Gonzales |
| Area | |
| • Total | 0.52 sq mi (1.35 km2) |
| • Land | 0.52 sq mi (1.35 km2) |
| • Water | 0.00 sq mi (0.00 km2) |
| Elevation | 312 ft (95 m) |
| Population (2020) | |
| • Total | 475 |
| • Density | 1,094.05/sq mi (422.34/km2) |
| Time zone | UTC-6 (Central (CST)) |
| • Summer (DST) | UTC-5 (CDT) |
| ZIP code | 78159 |
| Area code | 830 |
| FIPS code | 48-68300[2] |
| GNIS feature ID | 1368454[3] |
| Website | https://smileytx.com/ |
Smiley is a city in Gonzales County, Texas, United States. The population was 475 at the 2020 census,[4] down from 549 at the 2010 census.
As of 2021, the city has started to consider further annexation of land, new subdivision development, while excepting a manufactured home on a lot no larger than "0.05 acres." Generally the city only allows such homes on single-acre lots.[5]
The city is served by the Nixon-Smiley Consolidated Independent School District. Smiley has two cafes, no gas stations, a Wells Fargo bank and one blinking traffic signal at the intersection of US87 and FM108.
Geography
Smiley is located in southern Gonzales County at 29°16′10″N 97°38′13″W / 29.26944°N 97.63694°W (29.269402, –97.636850).[6] U.S. Route 87 passes through the center of town, leading west 8 miles (13 km) to Nixon and southeast 11 miles (18 km) to Westhoff. Gonzales, the county seat, is 21 miles (34 km) to the northeast, and San Antonio is 60 miles (97 km) to the west.
According to the United States Census Bureau, Smiley has a total area of 0.50 square miles (1.3 km2), all land.[4]
Demographics
| Census | Pop. | Note | %± |
|---|---|---|---|
| 1950 | 503 | — | |
| 1960 | 455 | −9.5% | |
| 1970 | 440 | −3.3% | |
| 1980 | 505 | 14.8% | |
| 1990 | 463 | −8.3% | |
| 2000 | 453 | −2.2% | |
| 2010 | 549 | 21.2% | |
| 2020 | 475 | −13.5% | |
| U.S. Decennial Census[7] | |||
| Race | Number | Percentage |
|---|---|---|
| White (NH) | 130 | 27.37% |
| Black or African American (NH) | 3 | 0.63% |
| Native American or Alaska Native (NH) | 1 | 0.21% |
| Asian (NH) | 1 | 0.21% |
| Pacific Islander (NH) | 2 | 0.42% |
| Mixed/Multi-Racial (NH) | 7 | 1.47% |
| Hispanic or Latino | 331 | 69.38% |
| Total | 475 |
As of the 2020 United States census, there were 475 people, 232 households, and 148 families residing in the city.
As of the census[2] of 2000, there were 453 people, 178 households, and 126 families residing in the city. The population density was 869.8 inhabitants per square mile (335.8/km2). There were 202 housing units at an average density of 387.9 per square mile (149.8/km2). The racial makeup of the city was 75.06% White, 0.66% Native American, 20.75% from other races, and 3.53% from two or more races. Hispanic or Latino of any race were 61.59% of the population.
There were 178 households, out of which 36.0% had children under the age of 18 living with them, 50.6% were married couples living together, 14.6% had a female householder with no husband present, and 29.2% were non-families. 28.1% of all households were made up of individuals, and 20.8% had someone living alone who was 65 years of age or older. The average household size was 2.54 and the average family size was 3.08.
In the city, the population was spread out, with 28.7% under the age of 18, 9.3% from 18 to 24, 22.3% from 25 to 44, 15.7% from 45 to 64, and 24.1% who were 65 years of age or older. The median age was 37 years. For every 100 females, there were 105.9 males. For every 100 females age 18 and over, there were 95.8 males.
The median income for a household in the city was $21,591, and the median income for a family was $25,000. Males had a median income of $27,500 versus $15,500 for females. The per capita income for the city was $11,823. About 19.0% of families and 27.0% of the population were below the poverty line, including 37.3% of those under age 18 and 20.4% of those age 65 or over.
References
- ↑ "2019 U.S. Gazetteer Files". United States Census Bureau. Retrieved August 7, 2020.
- 1 2 "U.S. Census website". United States Census Bureau. Retrieved January 31, 2008.
- ↑ "US Board on Geographic Names". United States Geological Survey. October 25, 2007. Retrieved January 31, 2008.
- 1 2 "Geographic Identifiers: 2010 Demographic Profile Data (G001): Smiley city, Texas". American Factfinder. U.S. Census Bureau. Retrieved March 15, 2017.
- ↑ Sjoberg, Brooke. "Smiley considers Unity subdivision, welcomes Deputy". Gonzales Inquirer. Retrieved April 17, 2021.
- ↑ "US Gazetteer files: 2010, 2000, and 1990". United States Census Bureau. February 12, 2011. Retrieved April 23, 2011.
- ↑ "Census of Population and Housing". Census.gov. Retrieved June 4, 2015.
- ↑ "Explore Census Data". data.census.gov. Retrieved May 25, 2022.
- ↑ https://www.census.gov/
- ↑ "About the Hispanic Population and its Origin". www.census.gov. Retrieved May 18, 2022.
