| St Pancras North | |
|---|---|
| Former Borough constituency for the House of Commons | |
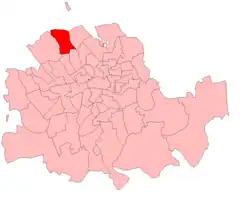 St Pancras North in London 1885–1918 | |
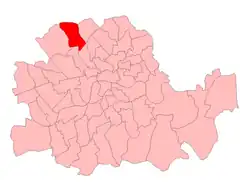 St Pancras North in London 1918–50 | |
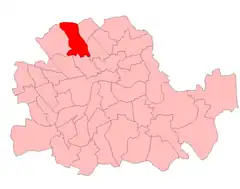 St Pancras North in London 1950–74 | |
| County | County of London |
| 1885–1983 | |
| Seats | One |
| Created from | Marylebone |
| Replaced by | Holborn & St Pancras and Hampstead & Highgate[1] |
St. Pancras North was a borough constituency represented in the House of Commons of the Parliament of the United Kingdom. It elected one Member of Parliament (MP) by the first-past-the-post system of election. It was created in 1885 and abolished in 1983 with the area becoming part of the new constituency of Holborn and St Pancras.
Boundaries

1918–1950: The Metropolitan Borough of St Pancras wards of one and two, and the part of ward number three lying to the north and west of a line running along the middle of Camden Road from a point where that road is intersected by the eastern boundary of the metropolitan borough to the point where that road crosses the Regent's Canal and thence westward along the middle of that canal to the western boundary of Ward number three.
1950–1974: The Metropolitan Borough of St Pancras wards of one, two, three and four.
1974–1983: The London Borough of Camden wards of Camden, Chalk Farm, Gospel Oak, Grafton, Highgate, and St John's.[2]
Members of Parliament
| Election | Member | Party | Notes | |
|---|---|---|---|---|
| 1885 | Thomas Henry Bolton | Liberal | ||
| 1886 | Charles Cochrane-Baillie | Conservative | later Baron Lamington | |
| 1890 by-election | Thomas Henry Bolton | Liberal | Bolton was re-elected in 1892 as a Liberal, but later joined the Liberal Unionists | |
| 1893? | Liberal Unionist Party | |||
| 1895 | Edward Robert Pacy Moon | Conservative | ||
| 1906 | Willoughby Dickinson | Liberal | later 1st Baron Dickinson | |
| 1918 | John Lorden | Coalition Conservative | ||
| 1922 | Conservative | |||
| 1923 | James Marley | Labour | ||
| 1924 | Ian Fraser | Conservative Party | ||
| 1929 | James Marley | Labour | ||
| 1931 | Ian Fraser | Conservative Party | later Baron Fraser of Lonsdale | |
| 1937 by-election | Robert Grant-Ferris | Conservative Party | later Baron Harvington | |
| 1945 | George House | Labour | ||
| 1949 by-election | Kenneth Robinson | Labour | Minister of Health 1964–1968 | |
| 1970 | Albert Stallard | Labour | ||
| 1983 | constituency abolished: see Holborn & St Pancras | |||
Election results
Elections in the 1880s
| Party | Candidate | Votes | % | ±% | |
|---|---|---|---|---|---|
| Liberal | Thomas Henry Bolton | 2,380 | 55.4 | ||
| Conservative | Charles Cochrane-Baillie | 1,915 | 44.6 | ||
| Majority | 465 | 10.8 | |||
| Turnout | 4,295 | 78.8 | |||
| Registered electors | 5,450 | ||||
| Liberal win (new seat) | |||||
| Party | Candidate | Votes | % | ±% | |
|---|---|---|---|---|---|
| Conservative | Charles Cochrane-Baillie | 2,074 | 53.4 | +8.8 | |
| Liberal | Thomas Henry Bolton | 1,813 | 46.6 | −8.8 | |
| Majority | 261 | 6.8 | N/A | ||
| Turnout | 3,887 | 71.3 | −7.5 | ||
| Registered electors | 5,450 | ||||
| Conservative gain from Liberal | Swing | +8.8 | |||
Elections in the 1890s
Cochrane-Baillie was elevated to the peerage as Lord Lamington.
| Party | Candidate | Votes | % | ±% | |
|---|---|---|---|---|---|
| Liberal | Thomas Henry Bolton | 2,657 | 50.7 | +4.1 | |
| Conservative | Henry Robert Graham | 2,549 | 48.7 | −4.7 | |
| Independent | John Leighton[4] | 29 | 0.6 | New | |
| Majority | 108 | 2.0 | N/A | ||
| Turnout | 5,235 | 82.7 | +11.4 | ||
| Registered electors | 6,332 | ||||
| Liberal gain from Conservative | Swing | +4.4 | |||
| Party | Candidate | Votes | % | ±% | |
|---|---|---|---|---|---|
| Liberal | Thomas Henry Bolton | 2,643 | 50.2 | +3.6 | |
| Conservative | Edward Robert Pacy Moon | 2,583 | 49.1 | −4.3 | |
| Independent | John Leighton[4] | 35 | 0.7 | N/A | |
| Majority | 60 | 1.1 | N/A | ||
| Turnout | 5,261 | 77.6 | +6.3 | ||
| Registered electors | 6,784 | ||||
| Liberal gain from Conservative | Swing | +4.0 | |||
| Party | Candidate | Votes | % | ±% | |
|---|---|---|---|---|---|
| Conservative | Edward Robert Pacy Moon | 2,834 | 51.7 | +2.6 | |
| Liberal | Herbert Raphael | 2,623 | 47.8 | −2.4 | |
| Independent | John Leighton[4] | 29 | 0.5 | −0.2 | |
| Majority | 211 | 3.9 | N/A | ||
| Turnout | 5,486 | 75.6 | −2.0 | ||
| Registered electors | 7,256 | ||||
| Conservative gain from Liberal | Swing | +2.5 | |||
Elections in the 1900s
| Party | Candidate | Votes | % | ±% | |
|---|---|---|---|---|---|
| Conservative | Edward Robert Pacy Moon | 3,056 | 56.6 | +4.9 | |
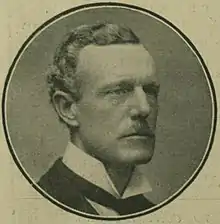
| Liberal | Willoughby Dickinson | 2,345 | 43.4 | −4.4 | |
| Majority | 711 | 13.2 | +9.3 | ||
| Turnout | 5,401 | 71.2 | −4.4 | ||
| Registered electors | 7,582 | ||||
| Conservative hold | Swing | +4.7 | |||
| Party | Candidate | Votes | % | ±% | |
|---|---|---|---|---|---|
| Liberal | Willoughby Dickinson | 4,094 | 60.8 | +17.4 | |
| Conservative | Edward Robert Pacy Moon | 2,643 | 39.2 | -17.4 | |
| Majority | 1,451 | 21.6 | N/A | ||
| Turnout | 6,737 | 84.0 | +12.8 | ||
| Registered electors | 8,021 | ||||
| Liberal gain from Conservative | Swing | +17.4 | |||
Elections in the 1910s
| Party | Candidate | Votes | % | ±% | |
|---|---|---|---|---|---|
| Liberal | Willoughby Dickinson | 4,970 | 58.0 | −2.8 | |
| Conservative | Hercules Pakenham | 3,603 | 42.0 | +2.8 | |
| Majority | 1,367 | 16.0 | −5.6 | ||
| Turnout | 8,573 | 85.9 | +1.9 | ||
| Registered electors | 9,977 | ||||
| Liberal hold | Swing | −2.8 | |||
| Party | Candidate | Votes | % | ±% | |
|---|---|---|---|---|---|
| Liberal | Willoughby Dickinson | 4,407 | 57.7 | -0.3 | |
| Conservative | Arthur Moon | 3,230 | 42.3 | +0.3 | |
| Majority | 1,177 | 15.4 | -0.6 | ||
| Turnout | 7,637 | 76.5 | -9.4 | ||
| Registered electors | 9,977 | ||||
| Liberal hold | Swing | -0.3 | |||
| Party | Candidate | Votes | % | ±% | |
|---|---|---|---|---|---|
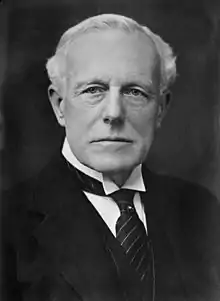
| C | Unionist | John Lorden | 7,260 | 41.4 | −0.9 |
| Liberal | Willoughby Dickinson | 5,596 | 32.0 | −25.7 | |
| Labour | John Gilbert Dale[5] | 4,651 | 26.6 | New | |
| Majority | 1,664 | 9.4 | N/A | ||
| Turnout | 33,747 | 51.9 | −24.6 | ||
| Unionist gain from Liberal | Swing | +12.4 | |||
| C indicates candidate endorsed by the coalition government. | |||||
Elections in the 1920s
| Party | Candidate | Votes | % | ±% | |
|---|---|---|---|---|---|
| Unionist | John Lorden | 9,156 | 37.7 | -3.7 | |
| Labour | John Gilbert Dale | 8,165 | 33.6 | +7.0 | |
| Liberal | Willoughby Dickinson | 6,979 | 28.7 | -3.3 | |
| Majority | 991 | 4.1 | -5.3 | ||
| Turnout | 24,300 | 66.0 | +14.1 | ||
| Unionist hold | Swing | ||||
| Party | Candidate | Votes | % | ±% | |
|---|---|---|---|---|---|
| Labour | James Marley | 10,931 | 43.0 | +9.4 | |
| Unionist | John Lorden | 8,085 | 31.9 | -5.8 | |
| Liberal | Henry Delacombe Roome | 6,363 | 25.1 | -3.6 | |
| Majority | 2,846 | 11.1 | N/A | ||
| Turnout | 25,379 | 68.2 | +2.2 | ||
| Labour gain from Unionist | Swing | +7.6 | |||
| Party | Candidate | Votes | % | ±% | |
|---|---|---|---|---|---|
| Unionist | Ian Fraser | 13,964 | 46.7 | +14.8 | |
| Labour | James Marley | 13,171 | 44.1 | +1.1 | |
| Liberal | Henry Delacombe Roome | 2,748 | 9.2 | -15.9 | |
| Majority | 793 | 2.6 | N/A | ||
| Turnout | 29,883 | 79.2 | +11.0 | ||
| Unionist gain from Labour | Swing | ||||
| Party | Candidate | Votes | % | ±% | |
|---|---|---|---|---|---|
| Labour | James Marley | 17,458 | 48.5 | +4.4 | |
| Unionist | Ian Fraser | 14,343 | 39.9 | -6.8 | |
| Liberal | Frederick L. Coysh | 4,177 | 11.6 | +2.4 | |
| Majority | 3,115 | 8.6 | N/A | ||
| Turnout | 35,978 | 76.0 | -3.2 | ||
| Labour gain from Unionist | Swing | +5.6 | |||
Elections in the 1930s
| Party | Candidate | Votes | % | ±% | |
|---|---|---|---|---|---|
| Conservative | Ian Fraser | 22,490 | 63.9 | +24.0 | |
| Labour | James Marley | 12,257 | 34.8 | -13.7 | |
| Communist | W G Shepherd | 456 | 1.3 | New | |
| Majority | 10,233 | 29.1 | N/A | ||
| Turnout | 35,203 | 73.4 | -2.6 | ||
| Conservative gain from Labour | Swing | ||||
| Party | Candidate | Votes | % | ±% | |
|---|---|---|---|---|---|
| Conservative | Ian Fraser | 16,888 | 53.7 | -10.2 | |
| Labour | Henry Montague Tibbles | 13,287 | 42.3 | +7.5 | |
| Liberal | William Otterburn Hall | 1,259 | 4.0 | New | |
| Majority | 3,601 | 11.4 | -17.7 | ||
| Turnout | 31,434 | 68.3 | -5.1 | ||
| Conservative hold | Swing | ||||
| Party | Candidate | Votes | % | ±% | |
|---|---|---|---|---|---|
| Conservative | Robert Grant-Ferris | 11,744 | 50.6 | -3.1 | |
| Labour | Henry Montague Tibbles | 11,476 | 49.4 | +7.1 | |
| Majority | 268 | 1.2 | -10.2 | ||
| Turnout | 23,220 | 50.9 | -13.4 | ||
| Conservative hold | Swing | ||||
Elections in the 1940s
| Party | Candidate | Votes | % | ±% | |
|---|---|---|---|---|---|
| Labour | George House | 16,738 | 63.8 | +21.5 | |
| Conservative | Robert Grant-Ferris | 9,108 | 34.7 | -19.0 | |
| Independent | John B. Gilmour | 403 | 1.5 | new | |
| Majority | 7,630 | 29.1 | n/a | ||
| Turnout | 36,979 | 71.0 | +2.7 | ||
| Labour gain from Conservative | Swing | ||||
| Party | Candidate | Votes | % | ±% | |
|---|---|---|---|---|---|
| Labour | Kenneth Robinson | 16,185 | 57.5 | -6.3 | |
| Conservative | Neil Shields | 11,118 | 39.5 | +4.8 | |
| Communist | John Mahon | 854 | 3.0 | new | |
| Majority | 5,067 | 18.0 | -10.9 | ||
| Turnout | 43,229 | 65.1 | -5.9 | ||
| Labour hold | Swing | ||||
Elections in the 1950s
| Party | Candidate | Votes | % | ±% | |
|---|---|---|---|---|---|
| Labour | Kenneth Robinson | 29,163 | 55.75 | ||
| Conservative | John Harvey | 19,028 | 36.38 | ||
| Liberal | Peter Maurice Charles Whitton | 3,148 | 6.02 | New | |
| Communist | Tom Ahern[6] | 967 | 1.85 | ||
| Majority | 10,135 | 19.37 | |||
| Turnout | 52,306 | 79.64 | |||
| Labour hold | Swing | ||||
| Party | Candidate | Votes | % | ±% | |
|---|---|---|---|---|---|
| Labour | Kenneth Robinson | 31,191 | 60.50 | ||
| Conservative | Charles A. B. Borrett | 20,362 | 39.50 | ||
| Majority | 10,829 | 21.00 | |||
| Turnout | 51,553 | 78.30 | |||
| Labour hold | Swing | ||||
| Party | Candidate | Votes | % | ±% | |
|---|---|---|---|---|---|
| Labour | Kenneth Robinson | 24,670 | 56.63 | ||
| Conservative | Anthony Royle | 17,588 | 40.38 | ||
| Communist | John Nicolson | 1,303 | 2.99 | New | |
| Majority | 7,082 | 16.25 | |||
| Turnout | 43,561 | 69.43 | |||
| Labour hold | Swing | ||||
| Party | Candidate | Votes | % | ±% | |
|---|---|---|---|---|---|
| Labour | Kenneth Robinson | 22,256 | 54.12 | ||
| Conservative | David Mitchell | 15,949 | 38.79 | ||
| National Labour | William Webster | 1,685 | 4.10 | New | |
| Communist | John Nicolson | 1,230 | 2.99 | ||
| Majority | 6,307 | 15.33 | |||
| Turnout | 41,120 | 69.47 | |||
| Labour hold | Swing | ||||
Elections in the 1960s
| Party | Candidate | Votes | % | ±% | |
|---|---|---|---|---|---|
| Labour | Kenneth Robinson | 20,516 | 61.04 | ||
| Conservative | Kenneth Warren | 11,954 | 35.57 | ||
| Communist | John Nicolson | 1,140 | 3.39 | ||
| Majority | 8,562 | 25.47 | |||
| Turnout | 33,610 | ||||
| Labour hold | Swing | ||||
| Party | Candidate | Votes | % | ±% | |
|---|---|---|---|---|---|
| Labour | Kenneth Robinson | 20,951 | 64.18 | ||
| Conservative | James Moorhouse | 10,440 | 31.98 | ||
| Communist | John Nicolson | 1,253 | 3.84 | ||
| Majority | 10,511 | 32.20 | |||
| Turnout | 32,644 | ||||
| Labour hold | Swing | ||||
Elections in the 1970s
| Party | Candidate | Votes | % | ±% | |
|---|---|---|---|---|---|
| Labour | Albert Stallard | 16,497 | 59.31 | ||
| Conservative | James Moorhouse | 10,648 | 38.28 | ||
| Communist | Gordon McLennan | 670 | 2.41 | ||
| Majority | 5,849 | 21.03 | |||
| Turnout | 27,815 | 62.21 | |||
| Labour hold | Swing | ||||
| Party | Candidate | Votes | % | ±% | |
|---|---|---|---|---|---|
| Labour | Albert Stallard | 14,761 | 52.76 | ||
| Conservative | John Major | 7,926 | 28.33 | ||
| Liberal | Paul J Medlicott | 4,825 | 17.25 | New | |
| Communist | Gordon McLennan | 466 | 1.67 | ||
| Majority | 6,835 | 24.43 | |||
| Turnout | 27,978 | 67.53 | |||
| Labour hold | Swing | ||||
| Party | Candidate | Votes | % | ±% | |
|---|---|---|---|---|---|
| Labour | Albert Stallard | 14,155 | 58.53 | ||
| Conservative | John Major | 6,602 | 27.30 | ||
| Liberal | Paul J Medlicott | 3,428 | 14.17 | ||
| Majority | 7,553 | 31.23 | |||
| Turnout | 24,185 | 58.10 | |||
| Labour hold | Swing | +3.4 | |||
| Party | Candidate | Votes | % | ±% | |
|---|---|---|---|---|---|
| Labour | Albert Stallard | 14,556 | 54.23 | ||
| Conservative | Peter Kirwan[7] | 9,110 | 33.94 | ||
| Liberal | Malcolm Valentine[7] | 2,654 | 9.89 | ||
| National Front | Stephen Andrews[7] | 360 | 1.34 | New | |
| Workers Revolutionary | Granville Jones[7] | 159 | 0.59 | New | |
| Majority | 5,446 | 20.29 | |||
| Turnout | 26,839 | 63.74 | |||
| Labour hold | Swing | ||||
References
- ↑ "'St Pancras North', Feb 1974 – May 1983". ElectionWeb Project. Cognitive Computing Limited. Retrieved 21 March 2016.
- ↑ "The Parliamentary Constituencies (London Borough of Camden) Order 1973", legislation.gov.uk, The National Archives, SI 1973/605, retrieved 26 February 2023
- 1 2 3 4 5 6 7 8 9 Craig, FWS, ed. (1974). British Parliamentary Election Results: 1885–1918. London: Macmillan Press. p. 42. ISBN 9781349022984.
- 1 2 3 Brasher, Stephen (16 July 2015). "The Returning Officer: Illustrations". New Statesman. Retrieved 16 November 2017.
- ↑ 'DALE, John Gilbert', Who Was Who, A & C Black, an imprint of Bloomsbury Publishing plc, 1920–2016; online edn, Oxford University Press, 2014 ; online edn, April 2014 accessed 19 Sept 2017
- ↑ Stevenson, Graham. "Ahern Tom". Retrieved 29 April 2017.
- 1 2 3 4 Election Expenses. Parliament of the United Kingdom. 1980. p. 11. ISBN 0102374805.