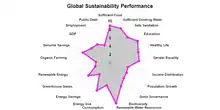
The Sustainable Society Index (SSI) shows the level of sustainability of 213 assessed countries. It shows in a simple way the distance to full sustainability for each of the 21 indicators that build up the SSI.[1] The SSI is used for monitoring the progress of a country on its way to sustainability, for setting policy priorities with respect to sustainability, to make comparisons between countries when assessing corporate risks, for education purposes, and for further research and development.

Development
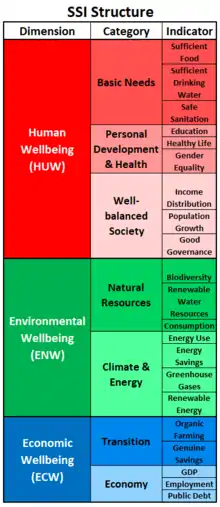
The SSI was developed by the Dutch Sustainable Society Foundation to provide the public at large, as well as politicians and authorities, with a transparent and easy tool to measure how sustainable a society is. The SSI is based on the Brundtland definition, and incorporates 21 indicators. These can be sorted into seven categories and three wellbeing dimensions. In 2020, production and development of SSI was taken over by Technische Hochschule Köln.
SSI data are published on a bi-annual basis. All data show the same cut-off date, usually two years prior to the edition's publication date. The latest edition (2018) contains sustainability data of the year 2016.
Triple bottom line
The Sustainable Society Index is one of the very few indices which includes all three wellbeing dimensions: Human, Environmental and Economic Wellbeing. As such they reflect the triple bottom line approach of sustainability.
2022 edition
The latest edition of the SSI covers data from 2000 to 2020. Time series analyses are possible over the period of 2000 to 2018. The 2019 and 2020 data are available as far as deliverers already have provided them.
2018 edition
The 2018 edition of the SSI demonstrated that the world is behind on sustainability in every of the three dimensions. In particular, the following results were found:
- On a sustainability scale of 1 (weakest) to 10 (strongest), the dimension representing global social sustainability, Human Wellbeing, scores highest, while Environmental and Economic Wellbeing lag behind.
- Across all dimensions, the global fulfillment of Basic Needs scores strongest (8), whereas climate protection and transition to a sustainable economic mode score lowest (<5).
- Over the reporting period 2006–2018 only the dimension of Human Wellbeing shows a continuous improvement
- 2018 scores confirm that economic and social sustainability are difficult to combine with environmental sustainability
- The negative link between income and environmental sustainability is strongest for the US and Sub Sahara Africa whereas Europe/Central Asia do not conform to this pattern.

References
- ↑ "Sustainable Society Foundation". Retrieved 23 August 2013.
External links
- Geurt van de Kerk and Arthur Manuel, A comprehensive index for a sustainable society: The SSI – the Sustainable Society Index. Ecological Economics, Vol (2008) 66(2–3), pages 228–242
- Sustainable Society Index