2007 Swiss federal election
Switzerland
21 October 2007

All 200 seats in the National Council (101 seats needed for a majority)
All 46 seats in the Council of States (24 seats needed for a majority)
Turnout48.3% Increase 3.1 pp
PartyLeader % Seats +/–
National Council
Swiss People's Ueli Maurer 28.9% 62 +7
Social Democrats Hans-Jürg Fehr 19.5% 43 −9
Free Democrats Fulvio Pelli 15.8% 31 −5
Christian Democrats Christophe Darbellay 14.5% 31 +3
Greens Ruth Genner 9.6% 20 +7
Liberals Claude Ruey 1.9% 4 0
Green Liberals Martin Bäumle 1.4% 3 New
Evangelical People's Ruedi Aeschbacher 2.4% 2 −1
Federal Democrats Hans Moser 1.3% 1 −1
Labour 0.7% 1 −1
Ticino League Giuliano Bignasca 0.6% 1 0
Christian Social Monika Bloch Süss 0.4% 1 0
Council of States
Christian Democrats 15 0
Free Democrats 12 −2
Social Democrats 9 0
Swiss People's 7 −1
Greens 2 +2
Green Liberals 1 +1
This lists parties that won seats. See the complete results below.
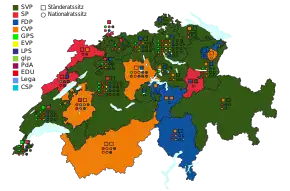
Map of Swiss cantons colored by the party that won the most votes. The seats that were won in the cantons for both the National Council and the Council of States are shown as well.

Elections to the Swiss Federal Assembly, the federal parliament of Switzerland, were held on Sunday, 21 October 2007. In a few cantons, a second round of the elections to the Council of States was held on 11 November, 18 November, and 25 November 2007. For the 48th legislative term of the federal parliament (2007–2011), voters in 26 cantons elected all 200 members of the National Council as well as 43 out of 46 members of the Council of States. The other three members of the Council of States for that term of service were elected at an earlier date.[1]

On 12 December 2007, the newly elected legislature elected the Swiss federal government, the Swiss Federal Council, for a four-year-term.

The results reflected yet another rise in support for the strongest party, the right-wing populist Swiss People's Party, at 29% of the popular vote, and the growth of the Green and Green Liberal parties at the expense of the Social Democrats.[2]

National Council

The Swiss People's Party successfully came out of the election as the strongest party, rising another 2.3% to 29.0% of the popular vote. Among the left-wing parties, support of the Social Democrats eroded to the benefit of the Green and Green Liberal parties.

The right-wing parties won 64 seats made up of the SVP with 62 seats and a single seat of the Christian right Federal Democratic Union and the regional Ticino League respectively. The left-wing parties won 65 seats, with 43 of the Social Democrats, 20 of the Green party, and the Christian-left Christian Social Party and the far-left Labour Party with a single seat each. The centrist parties won 71 seats, with the CVP and the centre-right FDP each having won 31 seats, and the remaining 9 seats won by minor parties: Liberals, 4 seats; Green Liberals, 3 seats; Evangelical People's Party, 2 seats.

59 of 200 seats (29.5%) were won by women, as compared to 50 in 2003. Ricardo Lumengo (Social Democrats, born in Angola) is notable as the first black Swiss national councillor. 23 incumbents did not get re-elected and lost their mandate, among them Zürich right wing politician Ulrich Schlüer (SVP). The turnout of the election was 48,9% a rise of 3,7% from the previous elections in 2003.

Results
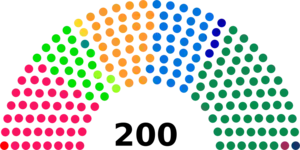
PartyVotes%Seats+/–
Swiss People's Party666,31828.5962+7
Social Democratic Party450,11619.3243–9
Free Democratic Party361,10315.5031–5
Christian Democratic People's Party332,92014.2931+3
Green Party220,7859.4720+7
Evangelical People's Party56,3612.422–1
Green Liberal Party49,3142.123New
Liberal Party42,3561.8240
Federal Democratic Union29,5481.271–1
Swiss Party of Labour16,6490.711–1
Ticino League13,0310.5610
Christian Social Party9,9850.4310
Others81,8973.510
Total2,330,383100.002000
Valid votes2,330,38398.20
Invalid/blank votes42,6881.80
Total votes2,373,071100.00
Registered voters/turnout4,915,56348.28
Source: Nohlen & Stöver

By constituency

Constituency Seats Electorate Turnout Party Votes Seats
won
Aargau 15 380,189 186,551 Swiss People's Party 942,792 6
Social Democratic Party 465,119 3
Free Democratic Party 354,366 2
Christian Democratic People's Party 351,915 3
Green Party 211,343 1
Evangelical People's Party 110,702 0
Liberal Center Forum 107,256 0
Federal Democratic Union 30,222 0
Swiss Democrats 17,287 0
Family Party 6,319 0
Appenzell Ausserrhoden 1 36,990 12,332 Free Democratic Party 7,780 1
Others 3,029 0
Appenzell Innerrhoden 1 10,901 2,300 Christian Democratic People's Party 1,736 1
Others 317 0
Basel-Landschaft 7 183,917 92,083 Swiss People's Party 177,852 2
Social Democratic Party 157,008 2
Free Democratic Party 106,081 1
Green Party 85,854 1
Christian Democratic People's Party 71,063 1
Evangelical People's Party 17,364 0
Swiss Democrats 4,987 0
Federal Democratic Union 2,948 0
Basel-Stadt 5 113,890 60,817 Social Democratic Party 102,522 2
Swiss People's Party 53,832 1
Green Party 35,301 1
Free Democratic Party 33,073 1
Liberal Party 23,325 0
Christian Democratic People's Party 21,494 0
Evangelical People's Party 10,406 0
People's Action 4,262 0
Swiss Democrats 2,000 0
Federal Democratic Union 1,463 0
Citizens' Party 557 0
Bern 26 700,435 325,042 Swiss People's Party 2,781,616 10
Social Democratic Party 1,754,359 6
Free Democratic Party 1,252,001 4
Green Party 1,067,741 3
Evangelical People's Party 450,506 1
Christian Democratic People's Party 305,392 1
Federal Democratic Union 294,168 1
Swiss Democrats 127,106 0
Liberal Socialists 87,980 0
Independent Health Party 69,540 0
Freedom Party 51,017 0
Men's Party 18,299 0
Interest Group Against Mismanagement 15,987 0
Jörg Stettler 6,675 0
Fribourg 7 173,530 83,216 Christian Democratic People's Party 140,154 2
Social Democratic Party 128,576 2
Swiss People's Party 124,683 1
Free Democratic Party 78,220 1
Christian Social Party 40,185 1
Green Party 35,819 0
Free List 6,012 0
Federal Democratic Union 4,972 0
Evangelical People's Party 4,349 0
For More Logic in Politics 1,589 0
Independent Citizens' Movement 1,349 0
Geneva 11 232,572 110,376 Swiss People's Party 245,239 2
Social Democratic Party 222,531 3
Green Party 190,735 2
Liberal Party 172,132 2
Christian Democratic People's Party 112,993 1
Free Democratic Party 90,219 1
Solidarity 57,021 0
Citizens' Movement 29,205 0
Party of Labour 21,689 0
Evangelical People's Party 13,909 0
The Communists 8,626 0
Glarus 1 25,550 8,326 Social Democratic Party 4,292 1
Swiss People's Party 2,712 0
Others 723 0
Grisons 5 132,200 55,331 Swiss People's Party 92,036 2
Social Democratic Party 62,828 1
Christian Democratic People's Party 53,911 1
Free Democratic Party 50,759 1
Federal Democratic Union 4,137 0
Daniel Trappitsch 1,525 0
Jura 2 49,571 22,109 Social Democratic Party 15,803 1
Christian Democratic People's Party 10,695 0
Swiss People's Party 5,855 1
Free Democratic Party 5,713 0
Christian Social Party 4,737 0
Lucerne 10 247,330 131,062 Christian Democratic People's Party 385,819 3
Swiss People's Party 322,633 3
Free Democratic Party 278,480 2
Social Democratic Party 146,671 1
Green Party 120,797 1
CHance21 12,694 0
Evangelical People's Party 9,559 0
Neuchâtel 5 107,147 53,816 Social Democratic Party 67,591 1
Swiss People's Party 60,446 1
Liberal Party 34,470 1
Free Democratic Party 33,126 1
Green Party 24,481 1
Party of Labour 23,914 0
Christian Democratic People's Party 8,731 0
Green Liberal Party 4,073 0
Evangelical People's Party 3,209 0
Free and Independent Party 740 0
Nidwalden 1 Elected unopposed Free Democratic Party 1
Obwalden 1 23,903 14,274 Swiss People's Party 4,523 1
Christian Democratic People's Party 4,462 0
Lukas Gasser 3,095 0
Social Democratic Party 1,589 0
Others 60 0
Schaffhausen 2 48,685 31,815 Swiss People's Party 23,860 1
Social Democratic Party 20,885 1
Free Democratic Party 16,288 0
Schwyz 4 94,048 49,198 Swiss People's Party 84,324 2
Christian Democratic People's Party 37,697 1
Free Democratic Party 31,375 0
Social Democratic Party 26,092 1
Green Party 6,284 0
Evangelical People's Party 1,771 0
Solothurn 7 168,927 85,668 Swiss People's Party 158,321 2
Free Democratic Party 122,435 1
Christian Democratic People's Party 118,979 2
Social Democratic Party 113,697 1
Green Party 58,338 1
Evangelical People's Party 10,313 0
Swiss Democrats 2,232 0
St. Gallen 12 300,034 140,365 Swiss People's Party 605,670 5
Christian Democratic People's Party 352,902 3
Social Democratic Party 242,580 2
Free Democratic Party 224,477 1
Green Party 104,572 1
Evangelical People's Party 33,542 0
Federal Democratic Union 16,249 0
Swiss Democrats 10,937 0
For Children and the Youth 6,995 0
Animal Welfare is Human Protection 5,984 0
Catholic People's Party 3,867 0
For Independent Ideas and Solutions in Politics 2,724 0
The East Swiss Party 461 0
Ticino 8 205,754 97,428 Free Democratic Party 208,633 3
Christian Democratic People's Party 179,055 2
Social Democratic Party 134,378 2
Ticino League 104,249 1
Swiss People's Party 64,907 0
Green Party 35,656 0
Party of Labour 9,411 0
Humanist Party 4,755 0
The Liberalists 1,051 0
Thurgau 6 153,214 71,849 Swiss People's Party 177,039 3
Christian Democratic People's Party 63,524 1
Free Democratic Party 50,575 1
Social Democratic Party 48,826 1
Green Party 42,778 0
Evangelical People's Party 11,839 0
Federal Democratic Union 10,975 0
Swiss Democrats 7,964 0
Alternative List 2,970 0
Catholic People's Party 1,590 0
Uri 1 25,712 6,206 Free Democratic Party 4,527 1
Others 661 0
Vaud 18 389,191 183,426 Swiss People's Party 666,818 5
Social Democratic Party 654,769 4
Free Democratic Party 433,474 3
Green Party 424,705 3
Liberal Party 240,348 1
Christian Democratic People's Party 166,881 1
Party of Labour 140,024 1
Green Liberal Party 109,174 0
Solidarity 62,742 0
Federal Democratic Union 37,438 0
Evangelical People's Party 32,380 0
Swiss Democrats 7,416 0
Valais 7 196,984 117,833 Christian Democratic People's Party 286,809 4
Swiss People's Party 129,306 1
Free Democratic Party 124,626 1
Social Democratic Party 114,613 1
Christian Social Party 62,522 0
Green Party 30,670 0
Liberal Party 7,853 0
Green Liberal Party 7,753 0
Alternative List 3,985 0
Citizens' Movement 2,037 0
Zug 3 70,478 37,864 Swiss People's Party 31,288 1
Christian Democratic People's Party 25,074 1
Free Democratic Party 23,132 0
Alternative Kanton Zug 18,285 1
Social Democratic Party 9,763 0
Zürich 34 844,381 413,454 Swiss People's Party 4,738,494 12
Social Democratic Party 2,767,366 7
Free Democratic Party 1,837,851 4
Green Party 1,448,189 4
Christian Democratic People's Party 1,055,571 3
Green Liberal Party 979,377 3
Evangelical People's Party 514,285 1
Federal Democratic Union 295,976 0
Alternative List 155,798 0
Swiss Democrats 75,477 0
Party of Labour 31,919 0
Hanf Ueli 21,444 0
Christian Social Party 20,541 0
Freedom Party 11,236 0
Humanist Party 9,512 0
Marian Danowski 7,757 0
Source: Bundesblatt, 27 November 2007

Council of States

Contrary to the developments in the National Council, the Council of States remains dominated by the traditional centrist parties FDP and CVP. Robert Cramer (Geneva) is the first member of the Green Party to be elected to the Council of States, joined in the second round by Luc Recordon of Vaud. Verena Diener (Zurich), formerly of the Green Party, wins a Council of States seat for the newly founded Green Liberal Party. Christine Egerszegi of Aargau (FDP) is the first woman councillor elected in that canton.

PartySeats+/–
Christian Democratic People's Party150
Free Democratic Party12–2
Social Democratic Party90
Swiss People's Party7–1
Green Party2+2
Green Liberal Party1+1
Total460
Source: Nohlen & Stöver

By canton

Canton Seat 1 Party Seat 2 Party
Zurich Felix Gutzwiller Free Democrats Verena Diener Green Liberals
Bern Simonetta Sommaruga * Social Democrats Werner Luginbühl Swiss People's Party
Lucerne Helen Leumann-Würsch * Free Democrats Konrad Graber Christian Democrats
Uri Hansruedi Stadler * Christian Democrats Hansheiri Inderkum * Christian Democrats
Schwyz Alex Kuprecht * Swiss People's Party Bruno Frick * Christian Democrats
Obwalden Hans Hess * Free Democrats N/A
Nidwalden Paul Niederberger Christian Democrats N/A
Glarus Franz Schiesser * Free Democrats This Jenny * Swiss People's Party
Zug Peter Bieri *[1] Christian Democrats Rolf Schweiger *[1] Free Democrats
Fribourg Urs Schwaller * Christian Democrats Alain Berset * Social Democrats
Solothurn Rolf Büttiker * Free Democrats Ernst Leuenberger * Social Democrats
Basel-Stadt Anita Fetz * Social Democrats N/A
Basel-Landschaft Claude Janiak Social Democrats N/A
Schaffhausen Peter Briner * Free Democrats Hannes Germann * Swiss People's Party
Appenzell AI Ivo Bischofberger[1] Christian Democrats N/A
Appenzell AR Hans Altherr * Free Democrats N/A
St. Gallen Erika Forster * Free Democrats Eugen David * Christian Democrats
Graubünden Christoffel Brändli * Swiss People's Party Theo Maissen * Christian Democrats
Aargau Christine Egerszegi Free Democrats Maximilian Reimann * Swiss People's Party
Thurgau Philipp Stähelin * Christian Democrats Hermann Bürgi * Swiss People's Party
Ticino Dick Marty * Free Democrats Filippo Lombardi * Christian Democrats
Vaud Géraldine Savary Social Democrats Luc Recordon Greens
Valais Jean-René Fournier Christian Democrats René Imoberdorf Christian Democrats
Neuchâtel Didier Burkhalter Free Democrats Gisèle Ory * Social Democrats
Geneva Liliane Maury Pasquier Social Democrats Robert Cramer Greens
Jura Claude Hêche Social Democrats Anne Seydoux-Christe Christian Democrats
* indicates a candidate that was re-elected.

Notes and references

  1. 1 2 3 4 The date of the election of the members of the Council of States is a matter of cantonal law. 24 cantons have chosen to let the elections coincide with the federally regulated National Council elections. Two cantons are electing their members of the Council of States at an earlier date: Zug reelected its incumbents Peter Bieri and Rolf Schweiger on 29 October 2006, while Appenzell Innerrhoden elected Ivo Bischofsberger as its one representative in that Council on 29 April 2007.
  2. main migration of voters was from SPS to GPS and GLP. Minor movements from CVP to GLP, and some migration from all of SPS, CVP and FDP to SVP

Bibliography

  • "Political Map of Switzerland" "Hermann, M. und Leuthold, H. (2003): Die politische Landkarte des Nationalrats 1999-2003. In: Tages-Anzeiger, 11. Oktober, 2003, Zürich."
  • Swiss Federal Statistical Office (3 December 2007). "Nationalratswahlen 2007. Der Wandel der Parteienlandschaft seit 1971". Archived from the original on 18 May 2008. Retrieved 3 December 2007. {{cite journal}}: Cite journal requires |journal= (help)
This article is issued from Wikipedia. The text is licensed under Creative Commons - Attribution - Sharealike. Additional terms may apply for the media files.