| Thirsk and Malton | |
|---|---|
| Former County constituency for the House of Commons | |
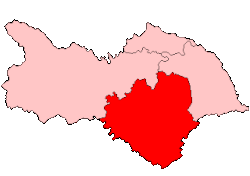
 Thirsk and Malton in North Yorkshire 1918–50 | |
| County | North Yorkshire |
| Major settlements | Pickering, Filey, Thirsk, Easingwold, Malton |
| 1885–1983 | |
| Seats | One |
| Created from | Thirsk and Malton; preceded by North Riding of Yorkshire |
| Replaced by | Ryedale, Richmond (Yorks), Selby and Skipton and Ripon[1] |
Thirsk and Malton was a constituency[n 1] represented in the House of Commons of the UK Parliament between 1885 and 1983. The constituency was revived in 2010.
History
Robin Turton was the Minister of Health (note head of department in that era) from December 1955 to January 1957. He also became father of the House and was among the longest-serving MPs for a single constituency, representing his seat for 44 years and 9 months.
Boundaries
1918-1950: The Urban District of Malton, the Rural Districts of Easingwold, Flaxton, Helmsley, Kirkbymoorside, Malton, Thirsk, and Wath, and part of the Rural District of Pickering.
1950-1974: The Urban District of Malton, the Rural Districts of Bedale, Easingwold, Flaxton, Helmsley, Kirkbymoorside, Malton, Thirsk, and Wath, and part of the Rural District of Pickering.
1974-1983: The Urban District of Malton, and the Rural Districts of Bedale, Easingwold, Flaxton, Helmsley, Kirkbymoorside, Malton, Thirsk, and Wath.
Members of Parliament
| Year | Member[2] | Party | |
|---|---|---|---|
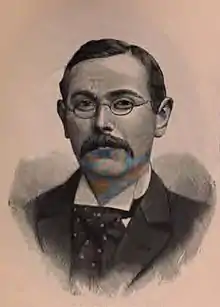
| 1885 | Lewis Payn Dawnay | Conservative | |
| 1892 | Sir John Lawson | Conservative | |
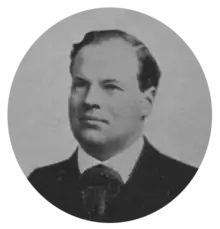
| 1906 | Charles Duncombe | Conservative | |
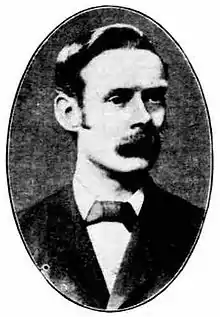
| 1915 | Sir Edmund Turton | Unionist | |
| 1929 | Sir Robin Turton | Conservative | |
| 1974 | John Spence | Conservative | |
| 1983 | Constituency abolished | ||
Elections
| Decades: |
Elections in the 1880s
| Party | Candidate | Votes | % | ±% | |
|---|---|---|---|---|---|
| Conservative | Lewis Payn Dawnay | 5,966 | 57.0 | N/A | |
| Liberal | Edmund Turton | 4,503 | 43.0 | N/A | |
| Majority | 1,463 | 14.0 | N/A | ||
| Turnout | 10,469 | 82.8 | N/A | ||
| Registered electors | 12,637 | ||||
| Conservative win (new seat) | |||||
| Party | Candidate | Votes | % | ±% | |
|---|---|---|---|---|---|
| Conservative | Lewis Payn Dawnay | Unopposed | |||
| Conservative hold | |||||
Elections in the 1890s

| Party | Candidate | Votes | % | ±% | |
|---|---|---|---|---|---|
| Conservative | John Lawson | 5,890 | 62.5 | N/A | |
| Liberal | Harold Reckitt | 3,541 | 37.5 | N/A | |
| Majority | 2,349 | 25.0 | N/A | ||
| Turnout | 9,431 | 77.2 | N/A | ||
| Registered electors | 12,220 | ||||
| Conservative hold | |||||

| Party | Candidate | Votes | % | ±% | |
|---|---|---|---|---|---|
| Conservative | John Lawson | Unopposed | |||
| Conservative hold | |||||
Elections in the 1900s
| Party | Candidate | Votes | % | ±% | |
|---|---|---|---|---|---|
| Conservative | John Lawson | Unopposed | |||
| Conservative hold | |||||

| Party | Candidate | Votes | % | ±% | |
|---|---|---|---|---|---|
| Conservative | Charles Duncombe | 5,848 | 53.7 | N/A | |
| Liberal | John J Brigg | 5,044 | 46.3 | N/A | |
| Majority | 804 | 7.4 | N/A | ||
| Turnout | 10,892 | 84.5 | N/A | ||
| Registered electors | 12,888 | ||||
| Conservative hold | |||||
Elections in the 1910s
| Party | Candidate | Votes | % | ±% | |
|---|---|---|---|---|---|
| Conservative | Charles Duncombe | 6,382 | 55.1 | +1.4 | |
| Liberal | John J Brigg | 5,197 | 46.9 | -1.4 | |
| Majority | 1,185 | 10.2 | 2.8 | ||
| Turnout | |||||
| Conservative hold | Swing | +1.4 | |||
| Party | Candidate | Votes | % | ±% | |
|---|---|---|---|---|---|
| Conservative | Charles Duncombe | Unopposed | |||
| Conservative hold | |||||

General Election 1914–15:
Another General Election was required to take place before the end of 1915. The political parties had been making preparations for an election to take place and by July 1914, the following candidates had been selected;
- Unionist: Edmund Turton
- Liberal: George Nicholls
| Party | Candidate | Votes | % | ±% | |
|---|---|---|---|---|---|
| Unionist | Edmund Turton | Unopposed | |||
| Unionist hold | |||||
| Party | Candidate | Votes | % | ±% | |
|---|---|---|---|---|---|
| C | Unionist | Edmund Turton | 9,656 | 69.1 | N/A |
| Liberal | Samuel S Lockwood | 4,317 | 30.9 | N/A | |
| Majority | 5,339 | 38.2 | N/A | ||
| Turnout | N/A | ||||
| Unionist hold | |||||
| C indicates candidate endorsed by the coalition government. | |||||
Elections in the 1920s
| Party | Candidate | Votes | % | ±% | |
|---|---|---|---|---|---|
| Unionist | Edmund Turton | Unopposed | |||
| Unionist hold | |||||
| Party | Candidate | Votes | % | ±% | |
|---|---|---|---|---|---|
| Unionist | Edmund Turton | 11,545 | 62.5 | N/A | |
| Liberal | William Haughton Sessions | 6,939 | 37.5 | N/A | |
| Majority | 4,606 | 25.0 | N/A | ||
| Turnout | 18,484 | N/A | |||
| Unionist hold | |||||
| Party | Candidate | Votes | % | ±% | |
|---|---|---|---|---|---|
| Unionist | Edmund Turton | 13,564 | 65.7 | +3.2 | |
| Liberal | William Haughton Sessions | 7,072 | 34.3 | -3.2 | |
| Majority | 6,492 | 31.4 | +6.4 | ||
| Turnout | 20,636 | ||||
| Unionist hold | Swing | +3.2 | |||
| Party | Candidate | Votes | % | ±% | |
|---|---|---|---|---|---|
| Unionist | Robert Turton | 16,084 | 59.2 | -6.5 | |
| Liberal | Thomas Sunley | 11,069 | 40.8 | +6.5 | |
| Majority | 5,015 | 18.5 | -13.0 | ||
| Turnout | 27,153 | 73.7 | |||
| Unionist hold | Swing | +6.5 | |||
Elections in the 1930s
| Party | Candidate | Votes | % | ±% | |
|---|---|---|---|---|---|
| Conservative | Robert Turton | Unopposed | |||
| Conservative hold | |||||
| Party | Candidate | Votes | % | ±% | |
|---|---|---|---|---|---|
| Conservative | Robert Turton | Unopposed | |||
| Conservative hold | |||||
Election in the 1940s
General Election 1939–40:
Another General Election was required to take place before the end of 1940. The political parties had been making preparations for an election to take place and by July 1939, the following candidates had been selected;
- Conservative: Robert Turton
| Party | Candidate | Votes | % | ±% | |
|---|---|---|---|---|---|
| Conservative | Robert Turton | 20,483 | 60.15 | N/A | |
| Common Wealth | Edward Moeran | 13,572 | 39.85 | N/A | |
| Majority | 6,911 | 20.29 | N/A | ||
| Turnout | 65.55 | N/A | |||
| Conservative hold | Swing | N/A | |||
Elections in the 1950s
| Party | Candidate | Votes | % | ±% | |
|---|---|---|---|---|---|
| Conservative | Robert Turton | 26,324 | 65.41 | ||
| Labour | Ivan Ernest Geffen | 11,480 | 28.53 | N/A | |
| Liberal | Harry Aldam | 2,441 | 6.07 | N/A | |
| Majority | 14,844 | 36.88 | |||
| Turnout | 81.51 | ||||
| Conservative hold | Swing | N/A | |||
| Party | Candidate | Votes | % | ±% | |
|---|---|---|---|---|---|
| Conservative | Robert Turton | 27,854 | 72.26 | ||
| Labour | Arnold John Parkinson | 10,692 | 27.74 | ||
| Majority | 17,162 | 44.52 | |||
| Turnout | 77.41 | ||||
| Conservative hold | Swing | ||||
| Party | Candidate | Votes | % | ±% | |
|---|---|---|---|---|---|
| Conservative | Robert Turton | 25,467 | 69.11 | ||
| Labour | George R Mitton | 11,382 | 30.89 | ||
| Majority | 14,085 | 38.22 | |||
| Turnout | 73.39 | ||||
| Conservative hold | Swing | ||||
| Party | Candidate | Votes | % | ±% | |
|---|---|---|---|---|---|
| Conservative | Robert Turton | 27,413 | 69.00 | ||
| Labour | Jeremy Bray | 12,318 | 31.00 | ||
| Majority | 15,095 | 37.99 | |||
| Turnout | 75.65 | ||||
| Conservative hold | Swing | ||||
Elections in the 1960s
| Party | Candidate | Votes | % | ±% | |
|---|---|---|---|---|---|
| Conservative | Robert Turton | 28,272 | 66.39 | ||
| Labour | Daniel Lorden Hussey | 14,315 | 33.61 | ||
| Majority | 13,957 | 32.77 | |||
| Turnout | 73.81 | ||||
| Conservative hold | Swing | ||||
| Party | Candidate | Votes | % | ±% | |
|---|---|---|---|---|---|
| Conservative | Robert Turton | 25,089 | 61.59 | ||
| Labour | Richard A Wilson | 15,647 | 38.41 | ||
| Majority | 9,442 | 23.18 | |||
| Turnout | 70.27 | ||||
| Conservative hold | Swing | ||||
Elections in the 1970s
| Party | Candidate | Votes | % | ±% | |
|---|---|---|---|---|---|
| Conservative | Robert Turton | 30,892 | 66.86 | ||
| Labour | Jonathan Richard Bradshaw | 15,309 | 33.14 | ||
| Majority | 15,583 | 33.73 | |||
| Turnout | 72.34 | ||||
| Conservative hold | Swing | ||||
| Party | Candidate | Votes | % | ±% | |
|---|---|---|---|---|---|
| Conservative | John Spence | 27,580 | 53.44 | ||
| Liberal | Michael JL Brooks | 13,172 | 25.52 | ||
| Labour | MD Coupe | 10,855 | 21.03 | ||
| Majority | 14,408 | 27.92 | |||
| Turnout | 81.46 | ||||
| Conservative hold | Swing | ||||
| Party | Candidate | Votes | % | ±% | |
|---|---|---|---|---|---|
| Conservative | John Spence | 24,779 | 53.24 | ||
| Liberal | Rodney Kent | 10,917 | 23.46 | ||
| Labour | RK Illingworth | 10,842 | 23.30 | ||
| Majority | 13,862 | 29.79 | |||
| Turnout | 72.88 | ||||
| Conservative hold | Swing | ||||
| Party | Candidate | Votes | % | ±% | |
|---|---|---|---|---|---|
| Conservative | John Spence | 32,520 | 59.15 | ||
| Labour | EJ Roberts | 11,924 | 21.69 | ||
| Liberal | Rex North | 10,533 | 19.16 | ||
| Majority | 20,596 | 37.46 | |||
| Turnout | 76.46 | ||||
| Conservative hold | Swing | ||||
See also
Notes and references
- Notes
- ↑ A county constituency (for the purposes of election expenses and type of returning officer)
- References
- ↑ "'Thirsk and Malton', Feb 1974 - May 1983". ElectionWeb Project. Cognitive Computing Limited. Retrieved 24 March 2016.
- ↑ Leigh Rayment's Historical List of MPs – Constituencies beginning with "T" (part 1)
- 1 2 3 4 5 6 7 Craig, F. W. S., ed. (1974). British Parliamentary Election Results: 1885-1918. London: Macmillan Press. p. 429. ISBN 9781349022984.
- 1 2 3 4 5 6 The Liberal Year Book, 1907
- ↑ Debrett's House of Commons & Judicial Bench, 1886
- 1 2 Debrett's House of Commons & Judicial Bench, 1901
- 1 2 Debrett's House of Commons & Judicial Bench, 1916
- 1 2 3 4 Craig, F. W. S. (1983). British parliamentary election results 1918–1949 (3 ed.). Chichester: Parliamentary Research Services. ISBN 0-900178-06-X.