| ||||||||||||||||||||||||||
All 10 Maryland electoral votes to the Electoral College | ||||||||||||||||||||||||||
|---|---|---|---|---|---|---|---|---|---|---|---|---|---|---|---|---|---|---|---|---|---|---|---|---|---|---|
| ||||||||||||||||||||||||||
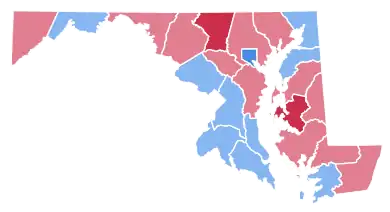
 County Results
| ||||||||||||||||||||||||||
| ||||||||||||||||||||||||||
| Elections in Maryland |
|---|
.svg.png.webp) |
|
|
The 1976 United States presidential election in Maryland was held on November 2, 1976 as part of the 1976 United States presidential election. Incumbent Republican President Gerald Ford of Michigan and his running mate Senator Bob Dole of Kansas lost to the Democratic challengers, Governor Jimmy Carter of Georgia and Senator Walter Mondale of Minnesota. Carter and Mondale won Maryland with 53.04% of the vote compared to Ford and Dole’s 46.96% – a comfortable margin of 6.08%.
After Nixon had won every county-equivalent in the state except for Baltimore City in 1972, Carter won ten of the state's 23 counties, most critically the populous Montgomery and Prince George's Counties in the Washington metropolitan area, and won Baltimore City by almost 100,000 raw votes. Carter began a Democratic winning streak in Prince George's County that continues to this day.[1]
As of 2020, this is the last election in which a Democrat carried Allegany, Calvert, Cecil, and St. Mary’s Counties.[2] This is also the last time the Democrat has won a majority of the vote in Kent County, though Democrats (including Carter in 1980) have won it by plurality four times since then.[3]
In this election, Maryland voted 4.01% to the left of the nation at-large.[4]
Results
| 1976 United States presidential election in Maryland[5] | ||||||
|---|---|---|---|---|---|---|
| Party | Candidate | Running mate | Votes | Percentage | Electoral votes | |
| Democratic | Jimmy Carter | Walter Mondale | 759,612 | 53.04% | 10 | |
| Republican | Gerald Ford | Bob Dole | 672,661 | 46.96% | 0 | |
Results by county
| County | James Earl Carter Democratic |
Gerald Rudolph Ford Republican |
Margin | Total votes cast[6] | |||
|---|---|---|---|---|---|---|---|
| # | % | # | % | # | % | ||
| Allegany | 15,967 | 50.85% | 15,435 | 49.15% | 532 | 1.69% | 31,402 |
| Anne Arundel | 54,351 | 46.97% | 61,353 | 53.03% | -7,002 | -6.05% | 115,704 |
| Baltimore | 118,505 | 45.27% | 143,293 | 54.73% | -24,788 | -9.47% | 261,798 |
| Baltimore City | 178,593 | 68.60% | 81,762 | 31.40% | 96,831 | 37.19% | 260,355 |
| Calvert | 4,626 | 57.36% | 3,439 | 42.64% | 1,187 | 14.72% | 8,065 |
| Caroline | 3,017 | 49.21% | 3,114 | 50.79% | -97 | -1.58% | 6,131 |
| Carroll | 9,940 | 38.83% | 15,661 | 61.17% | -5,721 | -22.35% | 25,601 |
| Cecil | 8,950 | 53.33% | 7,833 | 46.67% | 1,117 | 6.66% | 16,783 |
| Charles | 9,525 | 55.00% | 7,792 | 45.00% | 1,733 | 10.01% | 17,317 |
| Dorchester | 4,528 | 48.71% | 4,768 | 51.29% | -240 | -2.58% | 9,296 |
| Frederick | 14,542 | 44.77% | 17,941 | 55.23% | -3,399 | -10.46% | 32,483 |
| Garrett | 3,332 | 41.80% | 4,640 | 58.20% | -1,308 | -16.41% | 7,972 |
| Harford | 19,890 | 45.00% | 24,309 | 55.00% | -4,419 | -10.00% | 44,199 |
| Howard | 20,533 | 49.20% | 21,200 | 50.80% | -667 | -1.60% | 41,733 |
| Kent | 3,211 | 53.23% | 2,821 | 46.77% | 390 | 6.47% | 6,032 |
| Montgomery | 131,098 | 51.66% | 122,674 | 48.34% | 8,424 | 3.32% | 253,772 |
| Prince George's | 111,743 | 57.97% | 81,027 | 42.03% | 30,716 | 15.93% | 192,770 |
| Queen Anne's | 3,457 | 49.84% | 3,479 | 50.16% | -22 | -0.32% | 6,936 |
| Somerset | 3,472 | 51.62% | 3,254 | 48.38% | 218 | 3.24% | 6,726 |
| St. Mary's | 7,227 | 56.17% | 5,640 | 43.83% | 1,587 | 12.33% | 12,867 |
| Talbot | 3,715 | 38.85% | 5,848 | 61.15% | -2,133 | -22.30% | 9,563 |
| Washington | 15,902 | 44.05% | 20,194 | 55.95% | -4,292 | -11.89% | 36,096 |
| Wicomico | 9,412 | 47.18% | 10,537 | 52.82% | -1,125 | -5.64% | 19,949 |
| Worcester | 4,076 | 46.73% | 4,647 | 53.27% | -571 | -6.55% | 8,723 |
| Totals | 759,612 | 53.04% | 672,661 | 46.96% | 86,951 | 6.07% | 1,432,273 |
Counties that flipped from Republican to Democratic
See also
References
- ↑ 1976 Presidential General Election Data Graphs – Maryland by County
- ↑ Sullivan, Robert David; ‘How the Red and Blue Map Evolved Over the Past Century’; America Magazine in The National Catholic Review; June 29, 2016
- ↑ "Maryland". Google Docs. Retrieved August 13, 2022.
- ↑ "Dave Leip's Atlas of U.S. Presidential Elections". uselectionatlas.org. Retrieved March 31, 2023.
- ↑ "1976 Presidential General Election Results - Maryland". Retrieved September 18, 2015.
- ↑ Maryland State Board of Elections, ‘For President of the United States’ Maryland General Election Returns – November 2, 1976 (Annapolis, 1976)

.jpg.webp)
