Wattala | |
|---|---|
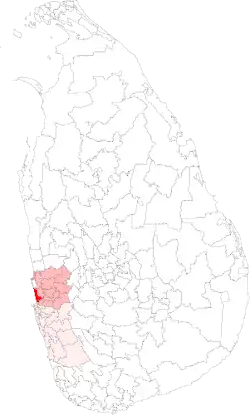 | |
| Coordinates: 7°01′28″N 79°53′31″E / 7.024564°N 79.891942°E | |
| Country | Sri Lanka |
| Province | Western Province, Sri Lanka |
| Electoral District | Gampaha Electoral District |
| Area | |
| • Total | 57.4 km2 (22.2 sq mi) |
| Population (2012)[1] | |
| • Total | 175,525 |
| • Density | 3,058/km2 (7,920/sq mi) |
| ISO 3166 code | EC-02A |
The Wattala Polling Division is a Polling Division in the Gampaha Electoral District, in the Western Province, Sri Lanka.
Presidential Election Results
Summary
The winner of Wattala has matched the final country result 6 out of 8 times. Hence, Wattala is a Weak Bellwether for Presidential Elections.
| Year | Wattala | Gampaha Electoral District | MAE[2] % | Sri Lanka | MAE[3] % | |||
|---|---|---|---|---|---|---|---|---|
| 2019 | NDF | SLPP | 12.22% | SLPP | 5.41% | |||
| 2015 | NDF | NDF | 9.49% | NDF | 7.79% | |||
| 2010 | UPFA | UPFA | 11.76% | UPFA | 8.31% | |||
| 2005 | UNP | UPFA | 11.68% | UPFA | 7.35% | |||
| 1999 | PA | PA | 7.18% | PA | 2.23% | |||
| 1994 | PA | PA | 4.21% | PA | 1.96% | |||
| 1988 | UNP | SLFP | 8.84% | UNP | 5.76% | |||
| 1982 | UNP | UNP | 9.59% | UNP | 7.43% | |||
| Matches/Mean MAE | 6/8 | 7/8 | 9.37% | 8/8 | 5.78% | |||
2019 Sri Lankan Presidential Election
| Party | Wattala[4] | Gampaha Electoral District | Sri Lanka | |||||||
|---|---|---|---|---|---|---|---|---|---|---|
| Votes | % | Votes | % | Votes | % | |||||
| NDF | 49,463 | 47.72% | 494,671 | 34.26% | 5,564,239 | 41.99% | ||||
| SLPP | 48,214 | 46.51% | 855,870 | 59.28% | 6,924,255 | 52.25% | ||||
| NMPP | 3,428 | 3.31% | 61,760 | 4.28% | 418,553 | 3.16% | ||||
| Other Parties (with < 1%) | 2,557 | 2.47% | 31,499 | 2.18% | 345,452 | 2.61% | ||||
| Valid Votes | 103,662 | 98.65% | 1,443,800 | 98.92% | 13,252,499 | 98.99% | ||||
| Rejected Votes | 1,418 | 1.35% | 15,751 | 1.08% | 135,452 | 1.01% | ||||
| Total Polled | 105,080 | 80.89% | 1,459,551 | 83.31% | 13,387,951 | 83.71% | ||||
| Registered Electors | 129,912 | 1,751,892 | 15,992,568 | |||||||
2015 Sri Lankan Presidential Election
| Party | Wattala[5] | Gampaha Electoral District | Sri Lanka | |||||||
|---|---|---|---|---|---|---|---|---|---|---|
| Votes | % | Votes | % | Votes | % | |||||
| NDF | 56,541 | 59.32% | 669,007 | 49.83% | 6,217,162 | 51.28% | ||||
| UPFA | 38,001 | 39.87% | 664,347 | 49.49% | 5,768,090 | 47.58% | ||||
| Other Parties (with < 1%) | 769 | 0.81% | 9,142 | 0.68% | 138,200 | 1.14% | ||||
| Valid Votes | 95,311 | 98.62% | 1,342,496 | 98.92% | 12,123,452 | 98.85% | ||||
| Rejected Votes | 1,332 | 1.38% | 14,647 | 1.08% | 140,925 | 1.15% | ||||
| Total Polled | 96,643 | 80.22% | 1,357,143 | 80.77% | 12,264,377 | 78.69% | ||||
| Registered Electors | 120,471 | 1,680,263 | 15,585,942 | |||||||
2010 Sri Lankan Presidential Election
| Party | Wattala[6] | Gampaha Electoral District | Sri Lanka | |||||||
|---|---|---|---|---|---|---|---|---|---|---|
| Votes | % | Votes | % | Votes | % | |||||
| UPFA | 39,316 | 49.67% | 718,716 | 61.66% | 6,015,934 | 57.88% | ||||
| NDF | 38,789 | 49.00% | 434,506 | 37.28% | 4,173,185 | 40.15% | ||||
| Other Parties (with < 1%) | 1,055 | 1.33% | 12,426 | 1.07% | 204,494 | 1.97% | ||||
| Valid Votes | 79,160 | 98.96% | 1,165,648 | 99.24% | 10,393,613 | 99.03% | ||||
| Rejected Votes | 830 | 1.04% | 8,960 | 0.76% | 101,838 | 0.97% | ||||
| Total Polled | 79,990 | 76.99% | 1,174,608 | 78.03% | 10,495,451 | 66.70% | ||||
| Registered Electors | 103,893 | 1,505,363 | 15,734,587 | |||||||
2005 Sri Lankan Presidential Election
| Party | Wattala[7] | Gampaha Electoral District | Sri Lanka | |||||||
|---|---|---|---|---|---|---|---|---|---|---|
| Votes | % | Votes | % | Votes | % | |||||
| UNP | 40,984 | 56.03% | 481,764 | 44.23% | 4,706,366 | 48.43% | ||||
| UPFA | 31,446 | 42.99% | 596,698 | 54.78% | 4,887,152 | 50.29% | ||||
| Other Parties (with < 1%) | 718 | 0.98% | 10,815 | 0.99% | 123,521 | 1.27% | ||||
| Valid Votes | 73,148 | 98.82% | 1,089,277 | 98.94% | 9,717,039 | 98.88% | ||||
| Rejected Votes | 873 | 1.18% | 11,724 | 1.06% | 109,869 | 1.12% | ||||
| Total Polled | 74,021 | 78.37% | 1,101,001 | 79.17% | 9,826,908 | 69.51% | ||||
| Registered Electors | 94,455 | 1,390,691 | 14,136,979 | |||||||
1999 Sri Lankan Presidential Election
| Party | Wattala[8] | Gampaha Electoral District | Sri Lanka | |||||||
|---|---|---|---|---|---|---|---|---|---|---|
| Votes | % | Votes | % | Votes | % | |||||
| PA | 32,954 | 49.55% | 532,796 | 56.58% | 4,312,157 | 51.12% | ||||
| UNP | 30,566 | 45.96% | 353,969 | 37.59% | 3,602,748 | 42.71% | ||||
| JVP | 2,127 | 3.20% | 40,472 | 4.30% | 343,927 | 4.08% | ||||
| Other Parties (with < 1%) | 865 | 1.30% | 14,382 | 1.53% | 176,679 | 2.09% | ||||
| Valid Votes | 66,512 | 97.74% | 941,619 | 97.84% | 8,435,754 | 97.69% | ||||
| Rejected Votes | 1,541 | 2.26% | 20,768 | 2.16% | 199,536 | 2.31% | ||||
| Total Polled | 68,053 | 77.00% | 962,387 | 77.12% | 8,635,290 | 72.17% | ||||
| Registered Electors | 88,377 | 1,247,860 | 11,965,536 | |||||||
1994 Sri Lankan Presidential Election
| Party | Wattala[9] | Gampaha Electoral District | Sri Lanka | |||||||
|---|---|---|---|---|---|---|---|---|---|---|
| Votes | % | Votes | % | Votes | % | |||||
| PA | 37,373 | 60.55% | 550,654 | 64.74% | 4,709,205 | 62.28% | ||||
| UNP | 23,671 | 38.35% | 288,608 | 33.93% | 2,715,283 | 35.91% | ||||
| Other Parties (with < 1%) | 676 | 1.10% | 11,256 | 1.32% | 137,040 | 1.81% | ||||
| Valid Votes | 61,720 | 98.53% | 850,518 | 98.48% | 7,561,526 | 98.03% | ||||
| Rejected Votes | 922 | 1.47% | 13,137 | 1.52% | 151,706 | 1.97% | ||||
| Total Polled | 62,642 | 73.25% | 863,655 | 74.16% | 7,713,232 | 69.12% | ||||
| Registered Electors | 85,516 | 1,164,625 | 11,158,880 | |||||||
1988 Sri Lankan Presidential Election
| Party | Wattala[10] | Gampaha Electoral District | Sri Lanka | |||||||
|---|---|---|---|---|---|---|---|---|---|---|
| Votes | % | Votes | % | Votes | % | |||||
| UNP | 27,945 | 56.79% | 350,092 | 48.08% | 2,569,199 | 50.43% | ||||
| SLFP | 19,361 | 39.35% | 355,553 | 48.83% | 2,289,857 | 44.95% | ||||
| SLMP | 1,901 | 3.86% | 22,467 | 3.09% | 235,701 | 4.63% | ||||
| Valid Votes | 49,207 | 98.66% | 728,112 | 98.63% | 5,094,754 | 98.24% | ||||
| Rejected Votes | 666 | 1.34% | 10,108 | 1.37% | 91,499 | 1.76% | ||||
| Total Polled | 49,873 | 72.83% | 738,220 | 74.93% | 5,186,256 | 55.87% | ||||
| Registered Electors | 68,477 | 985,206 | 9,283,143 | |||||||
1982 Sri Lankan Presidential Election
| Party | Wattala[11] | Gampaha Electoral District | Sri Lanka | |||||||
|---|---|---|---|---|---|---|---|---|---|---|
| Votes | % | Votes | % | Votes | % | |||||
| UNP | 29,387 | 62.64% | 365,847 | 52.50% | 3,450,815 | 52.93% | ||||
| SLFP | 15,717 | 33.50% | 301,808 | 43.31% | 2,546,348 | 39.05% | ||||
| JVP | 1,402 | 2.99% | 23,701 | 3.40% | 273,428 | 4.19% | ||||
| Other Parties (with < 1%) | 410 | 0.87% | 5,491 | 0.79% | 249,460 | 3.83% | ||||
| Valid Votes | 46,916 | 99.10% | 696,847 | 99.15% | 6,520,156 | 98.78% | ||||
| Rejected Votes | 425 | 0.90% | 5,992 | 0.85% | 80,470 | 1.22% | ||||
| Total Polled | 47,341 | 81.60% | 702,839 | 82.70% | 6,600,626 | 80.15% | ||||
| Registered Electors | 58,015 | 849,896 | 8,235,358 | |||||||
Parliamentary Election Results
Summary
The winner of Wattala has matched the final country result 5 out of 7 times. Hence, Wattala is a Weak Bellwether for Parliamentary Elections.
| Year | Wattala | Gampaha Electoral District | MAE[12] % | Sri Lanka | MAE[13] % | |||
|---|---|---|---|---|---|---|---|---|
| 2015 | UNP | UNP | 9.77% | UNP | 8.91% | |||
| 2010 | UPFA | UPFA | 12.62% | UPFA | 10.37% | |||
| 2004 | UNP | UPFA | 10.25% | UPFA | 6.53% | |||
| 2001 | UNP | UNP | 7.92% | UNP | 4.48% | |||
| 2000 | UNP | PA | 6.52% | PA | 4.38% | |||
| 1994 | PA | PA | 6.69% | PA | 2.75% | |||
| 1989 | UNP | UNP | 5.29% | UNP | 5.54% | |||
| Matches/Mean MAE | 5/7 | 7/7 | 8.44% | 7/7 | 6.14% | |||
2020 Sri Lankan Parliamentary Election
| Party | Wattala[14] | Gampaha Electoral District | Sri Lanka | ||||||||
|---|---|---|---|---|---|---|---|---|---|---|---|
| Votes | % | Votes | % | Votes | % | ||||||
| SLPFA | 47,230 | 52.48% | 807,896 | 65.76% | 6,853,693 | 59.09% | |||||
| SJB | 34,706 | 38.56% | 285,809 | 23.27% | 2,771,984 | 23.9% | |||||
| JJB | 3,744 | 4.16% | 61,833 | 5.03% | 445,958 | 3.84% | |||||
| UNP | 2,138 | 2.38% | 28,282 | 2.3% | 249,435 | 2.15% | |||||
| Other Parties (with < 1%) | 2,185 | 2.42% | 44,654 | 3.64% | 1,227,859 | 11.02% | |||||
| Valid Votes | 90,003 | 67.62% | 1,228,474 | 68.78% | 11,598,936 | 71.32% | |||||
| Rejected Votes | 6,673 | 5.01% | 75,509 | 4.23% | 744,373 | 4.58% | |||||
| Total Polled | 96,676 | 72.63% | 1,303,983 | 73.01% | 12,343,309 | 75.89% | |||||
| Registered Electors | 133,103 | 1,785,964 | 16,263,885 | ||||||||
2015 Sri Lankan Parliamentary Election
| Party | Wattala[15] | Gampaha Electoral District | Sri Lanka | |||||||
|---|---|---|---|---|---|---|---|---|---|---|
| Votes | % | Votes | % | Votes | % | |||||
| UNP | 51,011 | 58.35% | 577,004 | 47.17% | 5,098,916 | 45.77% | ||||
| UPFA | 30,743 | 35.16% | 549,958 | 44.96% | 4,732,664 | 42.48% | ||||
| JVP | 5,141 | 5.88% | 87,880 | 7.18% | 544,154 | 4.88% | ||||
| Other Parties (with < 1%) | 532 | 0.61% | 8,332 | 0.68% | 81,501 | 0.73% | ||||
| Valid Votes | 87,427 | 95.12% | 1,223,174 | 95.51% | 11,140,333 | 95.35% | ||||
| Rejected Votes | 4,392 | 4.78% | 56,246 | 4.39% | 516,926 | 4.42% | ||||
| Total Polled | 91,910 | 76.29% | 1,280,647 | 78.21% | 11,684,111 | 77.66% | ||||
| Registered Electors | 120,471 | 1,637,537 | 15,044,490 | |||||||
2010 Sri Lankan Parliamentary Election
| Party | Wattala[16] | Gampaha Electoral District | Sri Lanka | |||||||
|---|---|---|---|---|---|---|---|---|---|---|
| Votes | % | Votes | % | Votes | % | |||||
| UPFA | 31,444 | 49.58% | 589,476 | 63.40% | 4,846,388 | 60.38% | ||||
| UNP | 26,659 | 42.03% | 266,523 | 28.67% | 2,357,057 | 29.37% | ||||
| DNA | 4,929 | 7.77% | 69,747 | 7.50% | 441,251 | 5.50% | ||||
| Other Parties (with < 1%) | 393 | 0.62% | 3,985 | 0.43% | 19,003 | 0.24% | ||||
| Valid Votes | 63,425 | 93.57% | 929,731 | 94.83% | 8,026,322 | 96.03% | ||||
| Rejected Votes | 4,328 | 6.38% | 50,234 | 5.12% | 581,465 | 6.96% | ||||
| Total Polled | 67,784 | 65.24% | 980,467 | 65.06% | 8,358,246 | 59.29% | ||||
| Registered Electors | 103,893 | 1,506,969 | 14,097,690 | |||||||
2004 Sri Lankan Parliamentary Election
| Party | Wattala[17] | Gampaha Electoral District | Sri Lanka | |||||||
|---|---|---|---|---|---|---|---|---|---|---|
| Votes | % | Votes | % | Votes | % | |||||
| UNP | 34,041 | 50.19% | 367,572 | 37.14% | 3,486,792 | 37.73% | ||||
| UPFA | 28,344 | 41.79% | 509,963 | 51.52% | 4,223,126 | 45.70% | ||||
| JHU | 4,525 | 6.67% | 102,516 | 10.36% | 552,723 | 5.98% | ||||
| Other Parties (with < 1%) | 911 | 1.34% | 9,691 | 0.98% | 57,229 | 0.62% | ||||
| Valid Votes | 67,821 | 96.07% | 989,742 | 95.96% | 9,241,931 | 94.52% | ||||
| Rejected Votes | 2,761 | 3.91% | 41,462 | 4.02% | 534,452 | 5.47% | ||||
| Total Polled | 70,598 | 76.81% | 1,031,464 | 77.72% | 9,777,821 | 75.74% | ||||
| Registered Electors | 91,912 | 1,327,145 | 12,909,631 | |||||||
2001 Sri Lankan Parliamentary Election
| Party | Wattala[18] | Gampaha Electoral District | Sri Lanka | |||||||
|---|---|---|---|---|---|---|---|---|---|---|
| Votes | % | Votes | % | Votes | % | |||||
| UNP | 37,592 | 53.82% | 437,289 | 43.94% | 4,086,026 | 45.62% | ||||
| PA | 24,651 | 35.29% | 428,780 | 43.08% | 3,330,815 | 37.19% | ||||
| JVP | 6,641 | 9.51% | 113,990 | 11.45% | 815,353 | 9.10% | ||||
| Other Parties (with < 1%) | 965 | 1.38% | 15,171 | 1.52% | 137,826 | 1.54% | ||||
| Valid Votes | 69,849 | 96.16% | 995,230 | 96.30% | 8,955,844 | 94.77% | ||||
| Rejected Votes | 2,791 | 3.84% | 38,187 | 3.70% | 494,009 | 5.23% | ||||
| Total Polled | 72,640 | 78.82% | 1,033,417 | 80.36% | 9,449,878 | 76.03% | ||||
| Registered Electors | 92,154 | 1,285,973 | 12,428,762 | |||||||
2000 Sri Lankan Parliamentary Election
| Party | Wattala[19] | Gampaha Electoral District | Sri Lanka | |||||||
|---|---|---|---|---|---|---|---|---|---|---|
| Votes | % | Votes | % | Votes | % | |||||
| UNP | 32,570 | 48.04% | 378,328 | 39.34% | 3,451,765 | 40.12% | ||||
| PA | 29,015 | 42.79% | 470,018 | 48.87% | 3,899,329 | 45.33% | ||||
| JVP | 4,146 | 6.11% | 73,110 | 7.60% | 518,725 | 6.03% | ||||
| SU | 1,320 | 1.95% | 20,297 | 2.11% | 127,859 | 1.49% | ||||
| Other Parties (with < 1%) | 752 | 1.11% | 19,956 | 2.08% | 319,123 | 3.71% | ||||
| Valid Votes | 67,803 | N/A | 961,709 | N/A | 8,602,617 | N/A | ||||
1994 Sri Lankan Parliamentary Election
| Party | Wattala[20] | Gampaha Electoral District | Sri Lanka | |||||||
|---|---|---|---|---|---|---|---|---|---|---|
| Votes | % | Votes | % | Votes | % | |||||
| PA | 32,311 | 50.18% | 509,030 | 56.79% | 3,887,805 | 48.94% | ||||
| UNP | 31,482 | 48.90% | 375,631 | 41.91% | 3,498,370 | 44.04% | ||||
| Other Parties (with < 1%) | 593 | 0.92% | 11,627 | 1.30% | 90,078 | 1.13% | ||||
| Valid Votes | 64,386 | 96.08% | 896,288 | 96.39% | 7,943,688 | 95.20% | ||||
| Rejected Votes | 2,627 | 3.92% | 33,553 | 3.61% | 400,395 | 4.80% | ||||
| Total Polled | 67,013 | 78.36% | 929,841 | 79.65% | 8,344,095 | 74.75% | ||||
| Registered Electors | 85,516 | 1,167,469 | 11,163,064 | |||||||
1989 Sri Lankan Parliamentary Election
| Party | Wattala[21] | Gampaha Electoral District | Sri Lanka | |||||||
|---|---|---|---|---|---|---|---|---|---|---|
| Votes | % | Votes | % | Votes | % | |||||
| UNP | 28,841 | 59.33% | 385,733 | 54.14% | 2,838,005 | 50.71% | ||||
| SLFP | 17,229 | 35.44% | 294,490 | 41.34% | 1,785,369 | 31.90% | ||||
| USA | 2,029 | 4.17% | 21,665 | 3.04% | 141,983 | 2.54% | ||||
| ELJP | 512 | 1.05% | 10,549 | 1.48% | 67,723 | 1.21% | ||||
| Valid Votes | 48,611 | 95.67% | 712,437 | 95.64% | 5,596,468 | 93.87% | ||||
| Rejected Votes | 2,200 | 4.33% | 32,497 | 4.36% | 365,563 | 6.13% | ||||
| Total Polled | 50,811 | 75.16% | 744,934 | 76.82% | 5,962,031 | 63.60% | ||||
| Registered Electors | 67,601 | 969,658 | 9,374,164 | |||||||
Demographics
Ethnicity
The Wattala Polling Division has a Sinhalese majority (71.1%) and a significant Sri Lankan Tamil population (18.8%) . In comparison, the Gampaha Electoral District (which contains the Wattala Polling Division) has a Sinhalese majority (90.5%) [1]
Ethnicity in Wattala[1]
Religion
The Wattala Polling Division has a Roman Catholic plurality (45.2%), a significant Buddhist population (29.9%) and a significant Hindu population (13.0%) . In comparison, the Gampaha Electoral District (which contains the Wattala Polling Division) has a Buddhist majority (71.3%) and a significant Roman Catholic population (19.5%) [1]
Religion in Wattala[1]
References
- 1 2 3 4 5 "Census of Population and Housing 2012". statistics.gov.lk. Department of Census and Statistics, Sri Lanka. 2012.
- ↑ The mean absolute error, between the percentages of votes each party got in Wattala and the Gampaha Electoral District. It is a measure of the difference in voting behaviour between the two regions.
- ↑ The mean absolute error, between the percentages of votes each party got in Wattala and the country. It is a measure of the difference in voting behaviour between the two regions.
- ↑ "2019 Sri Lankan presidential election Results". elections.gov.lk. Election Commission of Sri Lanka. 2019.
- ↑ "2015 Sri Lankan presidential election Results". elections.gov.lk. Election Commission of Sri Lanka. 2015.
- ↑ "2010 Sri Lankan presidential election Results". elections.gov.lk. Election Commission of Sri Lanka. 2010.
- ↑ "2005 Sri Lankan presidential election Results". elections.gov.lk. Election Commission of Sri Lanka. 2005.
- ↑ "1999 Sri Lankan presidential election Results". elections.gov.lk. Election Commission of Sri Lanka. 1999.
- ↑ "1994 Sri Lankan presidential election Results". elections.gov.lk. Election Commission of Sri Lanka. 1994.
- ↑ "1988 Sri Lankan presidential election Results". elections.gov.lk. Election Commission of Sri Lanka. 1988.
- ↑ "1982 Sri Lankan presidential election Results". elections.gov.lk. Election Commission of Sri Lanka. 1982.
- ↑ The mean absolute error, between the percentages of votes each party got in Wattala and the Gampaha Electoral District. It is a measure of the difference in voting behaviour between the two regions.
- ↑ The mean absolute error, between the percentages of votes each party got in Wattala and the country. It is a measure of the difference in voting behaviour between the two regions.
- ↑ "2020 Sri Lankan parliamentary election Results" (PDF). elections.gov.lk. Election Commission of Sri Lanka. 2020.
- ↑ "2015 Sri Lankan parliamentary election Results" (PDF). elections.gov.lk. Election Commission of Sri Lanka. 2015.
- ↑ "2010 Sri Lankan parliamentary election Results" (PDF). elections.gov.lk. Election Commission of Sri Lanka. 2010.
- ↑ "2004 Sri Lankan parliamentary election Results" (PDF). elections.gov.lk. Election Commission of Sri Lanka. 2004.
- ↑ "2001 Sri Lankan parliamentary election Results" (PDF). elections.gov.lk. Election Commission of Sri Lanka. 2001.
- ↑ "2000 Sri Lankan parliamentary election Results" (PDF). elections.gov.lk. Election Commission of Sri Lanka. 2000.
- ↑ "1994 Sri Lankan parliamentary election Results" (PDF). elections.gov.lk. Election Commission of Sri Lanka. 1994.
- ↑ "1989 Sri Lankan parliamentary election Results" (PDF). elections.gov.lk. Election Commission of Sri Lanka. 1989.