Williams County | |
|---|---|
 Williams County Courthouse | |
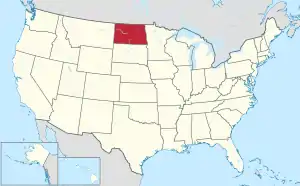
 Location within the U.S. state of North Dakota | |
 North Dakota's location within the U.S. | |
| Coordinates: 48°21′N 103°29′W / 48.35°N 103.48°W | |
| Country | |
| State | |
| Founded | 1891 |
| Named for | Erastus Appleman Williams |
| Seat | Williston |
| Largest city | Williston |
| Area | |
| • Total | 2,148 sq mi (5,560 km2) |
| • Land | 2,077 sq mi (5,380 km2) |
| • Water | 70 sq mi (200 km2) 3.3% |
| Population (2020) | |
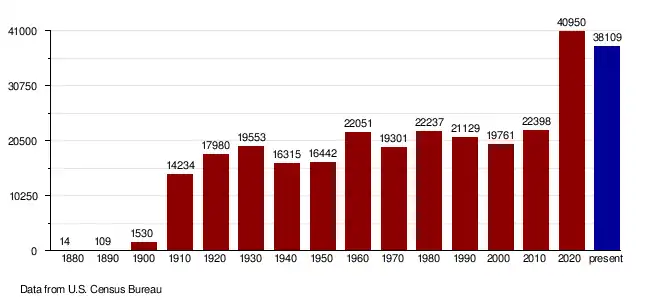
| • Total | 40,950 |
| • Estimate (2022) | 38,109 |
| • Density | 19/sq mi (7.4/km2) |
| Time zone | UTC−6 (Central) |
| • Summer (DST) | UTC−5 (CDT) |
| Congressional district | At-large |
| Website | www |
Williams County is located on the western border of the U.S. state of North Dakota, next to Montana. As of the 2020 census, the population was 40,950.[1] making it the fifth-most populous county in North Dakota. Its county seat is Williston.[2]
The Williston Micropolitan Statistical Area includes all of Williams County. It is bordered on the south by the upper Missouri River, whose confluence with its tributary Yellowstone River is located just east of the border with Montana.
History
There have been two Williams counties in the history of North Dakota. The first, created in 1873, was located south of the Missouri River near where Dunn and Mercer counties are today. This county continued to exist through North Dakota statehood, and while the second Williams County was created in 1891. The first Williams County was extinguished by a county referendum on November 8, 1892; part of its territory was absorbed by Mercer County and the rest reverted to an unorganized territory.
The second Williams County was created by the North Dakota legislature on March 2, 1891, from the previous counties of Buford and Flannery, which were dissolved. The government of this county was organized on December 8, 1891. This county's boundaries were altered in 1910, when a portion of its territory was annexed to create Divide County. Its boundaries have remained unchanged since then.[3]
The county is named for Erastus Appleman Williams, a European-American settler who served in the Dakota Territory legislature and the North Dakota legislature.[4]

Geography
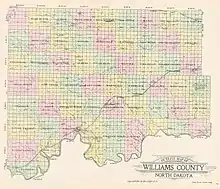
Williams County lies on the west edge of North Dakota. Its west boundary line abuts the east boundary line of the state of Montana. The Missouri River flows eastward along the county's south boundary line from the confluence with its tributary Yellowstone River, located on the Dakota side of the state border with Montana. Horse Creek and Willow Creek flow to the west across the upper portion of the county. The terrain consists of isolated hills amid rolling, hilly, semi-arid stretches. The area is partly devoted to agriculture.[5] The terrain is highest across its midpoint, and slopes to the NW and SE. Its highest point is a hill near the NE corner, at 2,470 ft (750 m) ASL.[6] The county has a total area of 2,148 square miles (5,560 km2), of which 2,077 square miles (5,380 km2) is land and 70 square miles (180 km2) (3.3%) is water.[7] It is the fourth-largest county in North Dakota by area.
Lake Sakakawea, a reservoir on the Missouri River, is situated on the southern boundary of the county. Little Muddy Creek is entirely within Williams County. The confluence of the Yellowstone River with the Missouri is west of Williston.
The Fort Union Trading Post National Historic Site is located in Williams County along the Missouri River on the Montana border.
Williams County is one of several western North Dakota counties with significant exposure to the Bakken formation in the Williston Basin.
Major highways
Transit
Adjacent counties
- Divide County (north)
- Burke County (northeast)
- Mountrail County (east)
- McKenzie County (south)
- Roosevelt County, Montana (southwest)
- Sheridan County, Montana (west)
Protected areas[5]
- Fort Union Trading Post National Historic Site (part)
- Hofflund State Game Management Area
- Lewis & Clark State Park
- Lake Zahl National Wildlife Refuge
- North Tobacco Garden State Game Management Area
Lakes[5]
- Alkali Lake
- Blacktail Lake
- Cottonwood Lake
- Epping Dam
- Green Lake
- Helle Slough
- Holm Lake
- Kota-Ray Dam
- Lake Trenton
- Lake Zahl
- McLeod Lake
- Shirley Lake
- Tioga River Dam
- Twin Lakes
Demographics
| Census | Pop. | Note | %± |
|---|---|---|---|
| 1880 | 14 | — | |
| 1890 | 109 | 678.6% | |
| 1900 | 1,530 | 1,303.7% | |
| 1910 | 14,234 | 830.3% | |
| 1920 | 17,980 | 26.3% | |
| 1930 | 19,553 | 8.7% | |
| 1940 | 16,315 | −16.6% | |
| 1950 | 16,442 | 0.8% | |
| 1960 | 22,051 | 34.1% | |
| 1970 | 19,301 | −12.5% | |
| 1980 | 22,237 | 15.2% | |
| 1990 | 21,129 | −5.0% | |
| 2000 | 19,761 | −6.5% | |
| 2010 | 22,398 | 13.3% | |
| 2020 | 40,950 | 82.8% | |
| 2022 (est.) | 38,109 | [8] | −6.9% |
| U.S. Decennial Census[9] 1790-1960[10] 1900-1990[11] 1990-2000[12] 2010-2020[1] | |||
2020 census
As of the census of 2020, there were 40,950 people, 20,227 households, and 15,286 families in the county.
2010 census
As of the census of 2010, there were 22,398 people, 9,293 households, and 5,746 families in the county. The population density was 10.8 inhabitants per square mile (4.2/km2). There were 10,464 housing units at an average density of 5.0 per square mile (1.9/km2). The racial makeup of the county was 92.1% white, 4.0% American Indian, 0.4% Asian, 0.3% black or African American, 0.3% from other races, and 2.9% from two or more races. Those of Hispanic or Latino origin made up 1.9% of the population. In terms of ancestry, 46.2% were of Norwegian, 35.9% of German, 9.8% of Irish, 4.5% of Swedish and 4.4% of English ancestry.
Of the 9,293 households, 28.5% had children under the age of 18 living with them, 49.8% were married couples living together, 7.7% had a female householder with no husband present, 38.2% were non-families, and 31.5% of all households were made up of individuals. The average household size was 2.35 and the average family size was 2.95. The median age was 39.0 years.
The median income for a household in the county was $55,396 and the median income for a family was $67,875. Males had a median income of $50,735 versus $27,071 for females. The per capita income for the county was $29,153. About 4.7% of families and 8.7% of the population were below the poverty line, including 9.7% of those under age 18 and 10.4% of those age 65 or over.
Population by decade

Media
- The Williston Herald
Communities
Cities
Census-designated places
Other unincorporated communities
Townships

- Athens
- Barr Butte
- Big Meadow
- Big Stone
- Blacktail
- Blue Ridge
- Bonetraill
- Brooklyn
- Buford
- Bull Butte
- Champion
- Climax
- Cow Creek
- Dry Fork
- Dublin
- East Fork
- Ellisville
- Equality
- Farmvale
- Golden Valley
- Good Luck
- Grenora
- Hardscrabble
- Hazel
- Hebron
- Judson
- Lindahl
- Marshall
- Missouri Ridge
- Mont
- New Home
- Oliver
- Orthell
- Pherrin
- Pleasant Valley
- Rainbow
- Rock Island
- Round Prairie
- Sauk Valley
- Scorio
- South Meadow
- Springbrook
- Stony Creek
- Strandahl
- Tioga
- Trenton
- Truax
- Twelve Mile
- Tyrone
- View
- West Bank
- Wheelock
- Williston
- Winner
Defunct townships
- Hofflund[13]
Politics
Williams County voters have been reliably Republican for decades. In no national election since 1964 has the county selected the Democratic Party candidate.
| Year | Republican | Democratic | Third party | |||
|---|---|---|---|---|---|---|
| No. | % | No. | % | No. | % | |
| 2020 | 11,739 | 81.90% | 2,169 | 15.13% | 426 | 2.97% |
| 2016 | 10,069 | 78.62% | 1,735 | 13.55% | 1,003 | 7.83% |
| 2012 | 7,184 | 73.25% | 2,322 | 23.67% | 302 | 3.08% |
| 2008 | 6,291 | 67.12% | 2,921 | 31.16% | 161 | 1.72% |
| 2004 | 6,278 | 70.31% | 2,512 | 28.13% | 139 | 1.56% |
| 2000 | 5,187 | 66.44% | 2,330 | 29.85% | 290 | 3.71% |
| 1996 | 3,590 | 45.79% | 3,018 | 38.49% | 1,232 | 15.71% |
| 1992 | 3,664 | 36.95% | 3,008 | 30.33% | 3,245 | 32.72% |
| 1988 | 5,653 | 57.87% | 4,004 | 40.99% | 111 | 1.14% |
| 1984 | 8,166 | 70.87% | 3,177 | 27.57% | 180 | 1.56% |
| 1980 | 6,530 | 65.93% | 2,545 | 25.70% | 829 | 8.37% |
| 1976 | 4,230 | 48.67% | 4,189 | 48.19% | 273 | 3.14% |
| 1972 | 4,800 | 59.90% | 2,989 | 37.30% | 225 | 2.81% |
| 1968 | 3,980 | 51.51% | 3,263 | 42.23% | 483 | 6.25% |
| 1964 | 3,076 | 36.45% | 5,352 | 63.42% | 11 | 0.13% |
| 1960 | 4,492 | 48.95% | 4,683 | 51.03% | 2 | 0.02% |
| 1956 | 4,188 | 50.07% | 4,157 | 49.70% | 19 | 0.23% |
| 1952 | 4,307 | 58.46% | 2,999 | 40.71% | 61 | 0.83% |
| 1948 | 2,133 | 38.82% | 2,571 | 46.79% | 791 | 14.39% |
| 1944 | 2,217 | 36.57% | 3,748 | 61.82% | 98 | 1.62% |
| 1940 | 2,470 | 34.25% | 4,579 | 63.50% | 162 | 2.25% |
| 1936 | 1,021 | 13.66% | 4,903 | 65.61% | 1,549 | 20.73% |
| 1932 | 1,509 | 21.92% | 4,823 | 70.06% | 552 | 8.02% |
| 1928 | 3,591 | 57.25% | 2,503 | 39.91% | 178 | 2.84% |
| 1924 | 1,865 | 36.76% | 308 | 6.07% | 2,900 | 57.17% |
| 1920 | 3,768 | 65.31% | 1,330 | 23.05% | 671 | 11.63% |
| 1916 | 903 | 28.28% | 1,769 | 55.40% | 521 | 16.32% |
| 1912 | 549 | 24.08% | 696 | 30.53% | 1,035 | 45.39% |
| 1908 | 1,979 | 60.41% | 1,034 | 31.56% | 263 | 8.03% |
| 1904 | 825 | 70.94% | 316 | 27.17% | 22 | 1.89% |
| 1900 | 249 | 71.97% | 95 | 27.46% | 2 | 0.58% |
Education
School districts include:[16]
- Divide County Public School District 1
- Eightmile Public School District 6
- Grenora Public School District 99
- Nesson Public School District 2
- Tioga Public School District 15
- Williston Basin School District 7
Former districts include:[16][17]
- Williston Public School District 1 - Merged into Williston Basin 7 in 2021.[18]
- Williams County Public School District 8 (formerly New Public School District 8, elementary only) - Merged into Williston Basin 7 in 2021.[18]
See also
References
- 1 2 "State & County QuickFacts". United States Census Bureau. Retrieved March 30, 2023.
- ↑ "Find a County". National Association of Counties. Retrieved June 7, 2011.
- ↑ "Dakota Territory, South Dakota, and North Dakota: Individual County Chronologies". Dakota Territory Atlas of Historical County Boundaries. The Newberry Library. 2006. Archived from the original on April 2, 2018. Retrieved February 3, 2015.
- ↑ "County History". Official Portal for North Dakota State Government. Archived from the original on February 2, 2015. Retrieved May 4, 2011.
- 1 2 3 4 5 Williams County ND Google Maps (accessed February 19, 2019)
- ↑ ""Find an Altitude/Williams County ND" Google Maps (accessed February 19, 2019)". Archived from the original on May 21, 2019. Retrieved February 19, 2019.
- ↑ "2010 Census Gazetteer Files". US Census Bureau. August 22, 2012. Archived from the original on January 29, 2015. Retrieved February 1, 2015.
- ↑ "Annual Estimates of the Resident Population for Counties: April 1, 2020 to July 1, 2022". Retrieved March 30, 2023.
- ↑ "US Decennial Census". United States Census Bureau. Retrieved February 1, 2015.
- ↑ "Historical Census Browser". University of Virginia Library. Retrieved February 1, 2015.
- ↑ Forstall, Richard L., ed. (April 20, 1995). "Population of Counties by Decennial Census: 1900 to 1990". United States Census Bureau. Retrieved February 1, 2015.
- ↑ "Census 2000 PHC-T-4. Ranking Tables for Counties: 1990 and 2000" (PDF). United States Census Bureau. April 2, 2001. Archived (PDF) from the original on March 27, 2010. Retrieved February 1, 2015.
- ↑ U.S. Census Bureau: Boundary Changes
- ↑ Leip, David. "Atlas of US Presidential Elections". uselectionatlas.org. Retrieved April 13, 2018.
- ↑ The leading "other" candidate, Socialist Eugene Debs received 588 votes, while Progressive Theodore Roosevelt, received 402 votes, Prohibition candidate Eugene Chafin received 45 votes.
- 1 2 "2020 CENSUS - SCHOOL DISTRICT REFERENCE MAP: Williams County, ND" (PDF). United States Census Bureau. Archived (PDF) from the original on August 13, 2021. Retrieved July 23, 2022. - Text list - This map was made before Williston Public School District 1 and Williams County Public School District 8 merged into Williston Basin School District 7.
- ↑ "SCHOOL DISTRICT REFERENCE MAP (2010 CENSUS): Williams County, ND" (PDF). U.S. Census Bureau. Retrieved July 23, 2022. - Text list
- 1 2 "Home". Williams County School District 8. Archived from the original on July 25, 2021. Retrieved August 21, 2021.
External links
- Williams County official website
- Map of southeastern portion of Williams County North Dakota DOT
- Map of northern portion of Williams County North Dakota DOT
- Map of southwestern portion of Williams County North Dakota DOT
