| Wisconsin's 68th State Assembly district | |||||
|---|---|---|---|---|---|
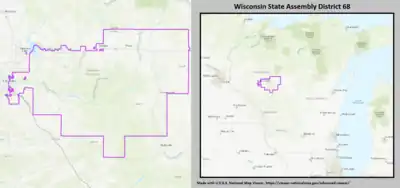
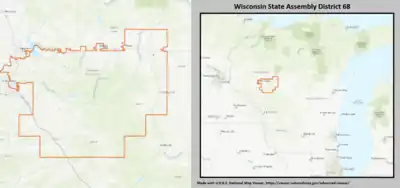
  2022 map defined in Johnson v. Wisconsin Elections Commission 2011 map was defined in 2011 Wisc. Act 43 | |||||
| Assemblymember |
| ||||
| Demographics | 90.6% White 2.1% Black 3.0% Hispanic 1.8% Asian 1.3% Native American 0.0% Hawaiian/Pacific Islander 1.1% Other | ||||
| Population (2020) • Voting age | 59,422[1] 44,409 | ||||
| Notes | Northwest Wisconsin | ||||
The 68th Assembly District of Wisconsin is one of 99 districts in the Wisconsin State Assembly.[2] Located in Northwestern Wisconsin, the district comprises the eastern half of Eau Claire County and about half of Clark County, as well as part of southeast Chippewa County. The district includes the cities of Altoona, Augusta, Greenwood, Osseo, Owen, Stanley, and Thorp.[3] The district is represented by Republican Karen Hurd, since January 2023.[4]


The 68th Assembly district is located within Wisconsin's 23rd Senate district, along with the 67th and 69th Assembly districts.
History
The district was created in the 1972 redistricting act (1971 Wisc. Act 304) which first established the numbered district system, replacing the previous system which allocated districts to specific counties.[5] The 68th district was drawn mostly in line with the former Eau Claire County 1st district (most of the city of Eau Claire), but added all of the remaining precincts of the city of Eau Claire. The last representative of the Eau Claire County 1st district, Joseph Looby, went on to win the first election to represent the 68th Assembly district.
The district boundaries have shifted over the various redistricting schemes since 1983, though the district had remained anchored on the city of Eau Claire until the controversial 2011 redistricting plan (2011 Wisc. Act 43) which divided the city between the 68th and 91st Assembly districts, and added vast stretches of Clark County and parts of Jackson and Trempealeau counties to the 68th district. As of the 2022 redistricting, barely any of the city of Eau Claire remains in this district.
List of past representatives
| Member | Party | Residence | Counties represented | Term start | Term end | Ref. |
|---|---|---|---|---|---|---|
| District created | ||||||
| Joseph Looby | Dem. | Eau Claire | Chippewa, Eau Claire | January 1, 1973 | January 1, 1979 | |
| William P. Gagin | Rep. | Eau Claire | January 1, 1979 | January 5, 1981 | ||
| Joseph Looby | Dem. | Eau Claire | January 5, 1981 | January 3, 1983 | ||
| John M. Young | Rep. | Brookfield | Milwaukee, Waukesha | January 3, 1983 | January 7, 1985 | |
| Joseph Looby | Dem. | Eau Claire | Chippewa, Eau Claire, Taylor | January 7, 1985 | January 2, 1989 | |
| David Zien | Rep. | Eau Claire | January 2, 1989 | April 12, 1993 | ||
| --Vacant-- | Chippewa, Eau Claire | April 12, 1993 | July 9, 1993 | |||
| David Plombon | Dem. | Stanley | July 9, 1993 | January 6, 1997 | ||
| Chuck Schafer | Rep. | Lafayette | January 6, 1997 | January 4, 1999 | ||
| Larry Balow | Dem. | Eau Claire | January 4, 1999 | January 3, 2005 | ||
| Terry Moulton | Rep. | Chippewa Falls | January 3, 2005 | January 5, 2009 | ||
| Kristen Dexter | Dem. | Eau Claire | January 5, 2009 | January 3, 2011 | ||
| Kathy Bernier | Rep. | Chippewa Falls | Chippewa, Clark, Eau Claire, Jackson, Trempealeau | January 3, 2011 | January 7, 2019 | [6] |
| Jesse L. James | Rep. | Altoona | January 7, 2019 | January 2, 2023 | [7] | |
| Karen Hurd | Rep. | Fall Creek | Chippewa, Clark, Eau Claire | January 3, 2023 | Current | [4] |
Electoral history
| Year | Date | Elected | Defeated | Total | Plurality | Other primary candidates | ||||||
|---|---|---|---|---|---|---|---|---|---|---|---|---|
| 1972[8] | Nov. 7 | Joseph Looby | Democratic | 12,599 | 59.07% | David Duax | Rep. | 8,730 | 40.93% | 21,329 | 3,869 | |
| 1974[9] | Nov. 5 | Joseph Looby (inc.) | Democratic | 9,507 | 90.00% | Joseph L. Larson | Amer. | 1,056 | 10.00% | 10,563 | 8,451 | |
| 1976[10] | Nov. 2 | Joseph Looby (inc.) | Democratic | 13,263 | 61.14% | Gerald R. Ritsch | Rep. | 8,430 | 38.86% | 21,693 | 4,833 |
|
| 1978[11] | Nov. 7 | William P. Gagin | Republican | 7,382 | 50.10% | Joseph Looby (inc.) | Dem. | 7,353 | 49.90% | 14,735 | 29 | |
| 1980[12] | Nov. 4 | Joseph Looby | Democratic | 13,398 | 57.20% | William P. Gagin (inc.) | Rep. | 10,025 | 42.80% | 23,423 | 3,373 |
|
| 1982[13] | Nov. 2 | John M. Young | Republican | 11,210 | 100.00% | 11,210 | 11,210 | Jerome P. Delfeld (Rep.) | ||||
| 1984[14] | Nov. 6 | Joseph Looby | Democratic | 12,878 | 63.14% | Allan G. Brown | Rep. | 7,518 | 36.86% | 20,396 | 5,360 | |
| 1986[15] | Nov. 4 | Joseph Looby (inc.) | Democratic | 7,470 | 50.82% | David A. Zien | Rep. | 7,228 | 49.18% | 14,698 | 242 | Norman Gillette (Rep.) |
| 1988[16] | Nov. 8 | David A. Zien | Republican | 11,093 | 52.65% | Joseph Looby (inc.) | Dem. | 9,978 | 47.35% | 21,071 | 1,115 | Douglas A. Kranig (Rep.) |
| 1990[17] | Nov. 6 | David A. Zien (inc.) | Republican | 8,337 | 52.92% | Colleen A. Bates | Dem. | 7,416 | 47.08% | 15,753 | 921 | |
| 1992[18] | Nov. 3 | David A. Zien (inc.) | Republican | 13,466 | 53.40% | Colleen A. Bates | Dem. | 11,752 | 46.60% | 25,218 | 1,714 | Richard Postlewaite (Dem.) |
| 1993[18][19] | June 29 | David Plombon | Democratic | 4,161 | 51.05% | Wayne E. Laufenberg | Rep. | 3,990 | 48.95% | 8,151 | 171 |
|
| 1994[20] | Nov. 8 | David Plombon (inc.) | Democratic | 7,750 | 50.12% | Wayne E. Laufenberg | Rep. | 7,217 | 46.67% | 15,464 | 533 |
|
| Mark S. Lawrence | Ind. | 497 | 3.21% | |||||||||
| 1996[21] | Nov. 5 | Chuck Schafer | Republican | 11,010 | 53.01% | David Plombon (inc.) | Dem. | 9,758 | 46.99% | 20,768 | 1,252 |
|
| 1998[22] | Nov. 3 | Larry Balow | Democratic | 8,210 | 51.42% | Chuck Schafer (inc.) | Rep. | 7,758 | 48.58% | 15,968 | 452 | |
| 2000[23] | Nov. 7 | Larry Balow (inc.) | Democratic | 12,909 | 53.47% | Howard J. Ludwigson | Rep. | 11,205 | 46.41% | 24,143 | 1,704 | Violet M. Dawes (Rep.) |
| 2002[24] | Nov. 5 | Larry Balow (inc.) | Democratic | 9,341 | 51.27% | Terry Moulton | Rep. | 8,858 | 48.62% | 18,218 | 483 | |
| 2004[25] | Nov. 2 | Terry Moulton | Republican | 16,665 | 54.09% | Joe Bee Xiong | Dem. | 14,094 | 45.74% | 30,810 | 2,571 | |
| 2006[26] | Nov. 7 | Terry Moulton (inc.) | Republican | 11,143 | 51.24% | Michael A. Turner | Dem. | 10,594 | 48.71% | 21,747 | 549 | |
| 2008[27] | Nov. 4 | Kristen Dexter | Democratic | 15,437 | 50.35% | Terry Moulton (inc.) | Rep. | 15,165 | 49.47% | 30,657 | 272 | |
| 2010[28] | Nov. 2 | Kathy Bernier | Republican | 10,765 | 50.15% | Kristen Dexter (inc.) | Dem. | 10,673 | 49.73% | 21,464 | 92 | |
| 2012[29] | Nov. 6 | Kathy Bernier (inc.) | Republican | 13,758 | 52.39% | Judy Smriga | Dem. | 12,482 | 47.53% | 26,263 | 1,276 | |
| 2014[30] | Nov. 4 | Kathy Bernier (inc.) | Republican | 11,289 | 52.82% | Jeff Peck | Dem. | 10,076 | 47.15% | 21,371 | 1,213 | |
| 2016[31] | Nov. 8 | Kathy Bernier (inc.) | Republican | 15,628 | 58.05% | Howard White | Dem. | 11,263 | 41.83% | 26,923 | 4,365 | |
| 2018[32] | Nov. 6 | Jesse L. James | Republican | 14,129 | 57.59% | Wendy Sue Johnson | Dem. | 10,394 | 42.37% | 24,533 | 3,735 | |
| 2020[33] | Nov. 3 | Jesse L. James (inc.) | Republican | 18,993 | 60.95% | Emily Berge | Dem. | 12,162 | 39.03% | 31,162 | 6,831 | |
| 2020[34] | Nov. 8 | Karen Hurd | Republican | 14,338 | 60.68% | Nate Otto | Dem. | 9,273 | 39.25% | 23,627 | 5,065 | Hillarie Roth (Rep.) Chris Connell (Rep.) |
References
- ↑ "LTSB Open Data: Wisconsin Assembly Districts (2022)". Wisconsin Legislative Technology Services Bureau. Retrieved November 20, 2022.
- ↑ "Assembly District 68". Wisconsin Legislature. Retrieved February 3, 2021.
- ↑ "Wisconsin Legislative Districts - Assembly District 68 Boundaries". Wisconsin Legislature. Retrieved February 3, 2021.
- 1 2 "Representative Karen R. Hurd". Wisconsin Legislature. Retrieved January 3, 2023.
- ↑ Wisconsin Legislative Reference Bureau (1973). "Legislature" (PDF). In Theobald, H. Rupert; Robbins, Patricia V. (eds.). The state of Wisconsin 1973 Blue Book (Report). Madison, Wisconsin: State of Wisconsin. pp. 227–230. Retrieved February 3, 2021.
- ↑ "Representative Kathleen Bernier". Wisconsin Legislature. Retrieved February 3, 2021.
- ↑ "Representative Jesse L. James". Wisconsin Legislature. Retrieved February 3, 2021.
- ↑ Wisconsin Legislative Reference Bureau (1973). "Elections" (PDF). In Theobald, H. Rupert; Robbins, Patricia V. (eds.). The state of Wisconsin 1973 Blue Book (Report). Madison, Wisconsin: State of Wisconsin. pp. 809, 828. Retrieved February 3, 2021.
- ↑ Wisconsin Legislative Reference Bureau (1975). "Elections" (PDF). In Theobald, H. Rupert; Robbins, Patricia V. (eds.). The state of Wisconsin 1975 Blue Book (Report). Madison, Wisconsin: State of Wisconsin. pp. 809, 830. Retrieved February 3, 2021.
- ↑ Wisconsin Legislative Reference Bureau (1977). "Elections" (PDF). In Theobald, H. Rupert; Robbins, Patricia V. (eds.). The state of Wisconsin 1977 Blue Book (Report). Madison, Wisconsin: State of Wisconsin. pp. 894, 916. Retrieved February 3, 2021.
- ↑ Wisconsin Legislative Reference Bureau (1979). "Elections" (PDF). In Theobald, H. Rupert; Robbins, Patricia V. (eds.). The state of Wisconsin 1979-1980 Blue Book (Report). Madison, Wisconsin: State of Wisconsin. pp. 907, 925. Retrieved February 3, 2021.
- ↑ Wisconsin Legislative Reference Bureau (1981). "Elections" (PDF). In Theobald, H. Rupert; Robbins, Patricia V. (eds.). The state of Wisconsin 1981-1982 Blue Book (Report). Madison, Wisconsin: State of Wisconsin. pp. 895, 916. Retrieved February 3, 2021.
- ↑ Wisconsin Legislative Reference Bureau (1983). "Elections" (PDF). In Theobald, H. Rupert; Robbins, Patricia V. (eds.). The state of Wisconsin 1983-1984 Blue Book (Report). Madison, Wisconsin: State of Wisconsin. pp. 890, 911. Retrieved February 3, 2021.
- ↑ Wisconsin Legislative Reference Bureau (1985). "Elections" (PDF). In Theobald, H. Rupert; Robbins, Patricia V. (eds.). The state of Wisconsin 1985-1986 Blue Book (Report). Madison, Wisconsin: State of Wisconsin. pp. 908, 926. Retrieved February 3, 2021.
- ↑ Wisconsin Legislative Reference Bureau (1987). "Elections" (PDF). In Theobald, H. Rupert; Barish, Lawrence S. (eds.). The state of Wisconsin 1987-1988 Blue Book (Report). Madison, Wisconsin: State of Wisconsin. pp. 889–890, 908. Retrieved February 3, 2021.
- ↑ Wisconsin Legislative Reference Bureau (1989). "Elections" (PDF). In Barish, Lawrence S.; Theobald, H. Rupert (eds.). State of Wisconsin 1989-1990 Blue Book (Report). Madison, Wisconsin: State of Wisconsin. pp. 911, 926. Retrieved February 3, 2021.
- ↑ Wisconsin Legislative Reference Bureau (1991). "Elections" (PDF). In Barish, Lawrence S.; Theobald, H. Rupert (eds.). State of Wisconsin 1991-1992 Blue Book (Report). Madison, Wisconsin: State of Wisconsin. pp. 901, 916. Retrieved February 3, 2021.
- 1 2 Wisconsin Legislative Reference Bureau (1993). "Elections" (PDF). In Barish, Lawrence S.; Theobald, H. Rupert (eds.). State of Wisconsin 1993-1994 Blue Book (Report). Madison, Wisconsin: State of Wisconsin. pp. 905–906, 923. Retrieved February 3, 2021.
- ↑ Wisconsin Legislative Reference Bureau (1993). "Addenda" (PDF). In Barish, Lawrence S.; Theobald, H. Rupert (eds.). State of Wisconsin 1993-1994 Blue Book (Report). Madison, Wisconsin: State of Wisconsin. p. 969. Retrieved February 3, 2021.
- ↑ Wisconsin Legislative Reference Bureau (1995). "Elections" (PDF). In Barish, Lawrence S. (ed.). State of Wisconsin 1995-1996 Blue Book (Report). Madison, Wisconsin: State of Wisconsin. pp. 905, 923. Retrieved February 3, 2021.
- ↑ Wisconsin Legislative Reference Bureau (1997). "Elections" (PDF). In Barish, Lawrence S. (ed.). State of Wisconsin 1997-1998 Blue Book (Report). Madison, Wisconsin: State of Wisconsin. pp. 901, 905. Retrieved February 3, 2021.
- ↑ Wisconsin Legislative Reference Bureau (1999). "Elections" (PDF). In Barish, Lawrence S.; Meloy, Patricia E. (eds.). State of Wisconsin 1999-2000 Blue Book (Report). Madison, Wisconsin: State of Wisconsin. pp. 880, 883. Retrieved February 3, 2021.
- ↑ Results of Fall General Election - 11/07/2000 (PDF) (Report). Wisconsin State Elections Board. May 10, 2001. p. 32. Retrieved February 3, 2021.
- ↑ Results of Fall General Election - 11/05/2002 (PDF) (Report). Wisconsin State Elections Board. December 2, 2002. p. 34. Retrieved February 3, 2021.
- ↑ Results of Fall General Election - 11/02/2004 (PDF) (Report). Wisconsin State Elections Board. December 1, 2004. p. 34. Retrieved February 3, 2021.
- ↑ Results of Fall General Election - 11/07/2006 (PDF) (Report). Wisconsin State Elections Board. December 5, 2006. p. 34. Retrieved February 3, 2021.
- ↑ Results of Fall General Election - 11/04/2008 (PDF) (Report). Wisconsin State Elections Board. November 25, 2008. p. 32. Retrieved February 3, 2021.
- ↑ 2010 Fall General Election Results Summary.pdf (PDF) (Report). Wisconsin Government Accountability Board. December 1, 2010. pp. 25–26. Retrieved February 3, 2021.
- ↑ Canvass Results for 2012 Presidential and General Election - 11/6/2012 (PDF) (Report). Wisconsin Government Accountability Board. December 26, 2012. p. 25. Retrieved February 3, 2021.
- ↑ Canvass Results for 2014 General Election - 11/4/2014 (PDF) (Report). Wisconsin Government Accountability Board. November 26, 2014. p. 24. Retrieved February 3, 2021.
- ↑ Canvass Results for 2016 General Election - 11/8/2016 (PDF) (Report). Wisconsin Elections Commission. December 22, 2016. p. 24. Retrieved February 3, 2021.
- ↑ Canvass Results for 2018 General Election - 11/6/2018 (PDF) (Report). Wisconsin Elections Commission. February 22, 2019. p. 24. Retrieved February 3, 2021.
- ↑ Canvass Results for 2020 General Election - 11/3/2020 (PDF) (Report). Wisconsin Elections Commission. November 18, 2020. p. 24. Retrieved February 3, 2021.
- ↑ Canvass Results for 2022 General Election - 11/8/2022 (Report). Wisconsin Elections Commission. November 30, 2022. p. 24. Retrieved December 1, 2022.