| |||||||||||||||||||||||||||||||||||||||||||||||||||||||||||||||||||||||||||||
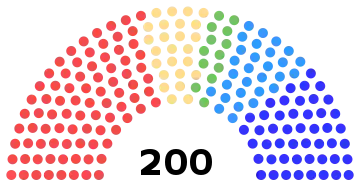
All 200 seats in the Parliament of Finland 101 seats needed for a majority | |||||||||||||||||||||||||||||||||||||||||||||||||||||||||||||||||||||||||||||
|---|---|---|---|---|---|---|---|---|---|---|---|---|---|---|---|---|---|---|---|---|---|---|---|---|---|---|---|---|---|---|---|---|---|---|---|---|---|---|---|---|---|---|---|---|---|---|---|---|---|---|---|---|---|---|---|---|---|---|---|---|---|---|---|---|---|---|---|---|---|---|---|---|---|---|---|---|---|
| |||||||||||||||||||||||||||||||||||||||||||||||||||||||||||||||||||||||||||||
 |
|---|
Parliamentary elections were held in the Grand Duchy of Finland on 1 and 3 May 1909.
Results
 | |||||
|---|---|---|---|---|---|
| Party | Votes | % | Seats | +/– | |
| Social Democratic Party | 337,685 | 39.89 | 84 | +1 | |
| Finnish Party | 199,920 | 23.62 | 48 | –7 | |
| Young Finnish Party | 122,770 | 14.50 | 29 | +3 | |
| Swedish People's Party | 104,191 | 12.31 | 25 | +1 | |
| Agrarian League | 56,943 | 6.73 | 13 | +3 | |
| Christian Workers' Union | 23,259 | 2.75 | 1 | –1 | |
| Others | 1,703 | 0.20 | 0 | – | |
| Total | 846,471 | 100.00 | 200 | 0 | |
| Valid votes | 846,471 | 99.27 | |||
| Invalid/blank votes | 6,212 | 0.73 | |||
| Total votes | 852,683 | 100.00 | |||
| Registered voters/turnout | 1,305,305 | 65.32 | |||
| Source: Mackie & Rose[1] | |||||
References
- ↑ Thomas T Mackie & Richard Rose (1991) The International Almanac of Electoral History, Macmillan, p243 (vote figures)
This article is issued from Wikipedia. The text is licensed under Creative Commons - Attribution - Sharealike. Additional terms may apply for the media files.

.jpg.webp)

