| |||||||||||||||||||||||||||||||
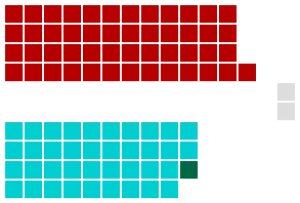
All 90 seats in the New South Wales Legislative Assembly 46 Assembly seats were needed for a majority | |||||||||||||||||||||||||||||||
|---|---|---|---|---|---|---|---|---|---|---|---|---|---|---|---|---|---|---|---|---|---|---|---|---|---|---|---|---|---|---|---|
| |||||||||||||||||||||||||||||||
 Legislative Assembly after the election | |||||||||||||||||||||||||||||||
| |||||||||||||||||||||||||||||||
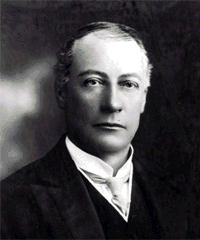
The 1913 New South Wales state election was held on 6 December 1913. This election was for all of the 90 seats in the 23rd New South Wales Legislative Assembly and it was conducted in single-member constituencies with a second ballot if a majority was not achieved on the first. The 22nd parliament of New South Wales was dissolved on 6 November 1913 by the Governor, Sir Gerald Strickland, on the advice of the Premier William Holman.[1][2][3]
There was a redistribution in 1912 as a result of the removal of the Australian Capital Territory from the state New South Wales and population growth in the Sydney metropolitan area. Labor won 7 of the 12 second round ballots.[4]
Key dates
| Date | Event |
|---|---|
| 6 November 1913 | The Legislative Assembly was dissolved, and writs were issued by the Governor to proceed with an election. |
| 15 November 1913 | Nominations for candidates for the election closed at noon. |
| 6 December 1913 | Polling day. |
| 23 December 1913 | Opening of 23rd Parliament. |
Results
|
New South Wales state election, 6 December 1913 [1] | ||||||
|---|---|---|---|---|---|---|
| Enrolled voters | 1,037,999 | |||||
| Votes cast | 668,601 | Turnout | 68.24 | 0.81 | ||
| Informal votes | 15,751 | Informal | 2.30 | +0.50 | ||
| Summary of votes by party | ||||||
| Party | Primary votes | % | Swing | Seats | Change | |
| Labor | 311,747 | 46.63 | −2.29 | 49 | +3 | |
| Liberal Reform | 219,525 | 32.83 | +10.2 | 28 | -9 | |
| Farmers and Settlers [lower-alpha 1] | 79,374 | 11.87 | +11.16 | 10 | +10 | |
| Independent Liberal | 16,324 | 2.44 | −3.42 | 0 | −6 | |
| Independent | 15,223 | 2.28 | +1.58 | 1 | 0 | |
| Country Party Association | 10,472 | 1.57 | +1.57 | 1 | +1 | |
| Independent Labor | 9,225 | 1.38 | +0.59 | 1 | +1 | |
| Others | 6,711 | 1.01 | +1.01 | 0 | - | |
| Total | 668,601 | 90 | ||||
Changing seats
See also
Notes
- ↑ Members of Farmers and Settlers were also endorsed by Liberal Reform.
- ↑ Swing is calculated using the Butler method, being the average of the 1913 winning party percentage-point gain and the 1910 losing party percentage-point loss. NA is used where one of the parties did not contest both elections.
- 1 2 Margin is calculated as the difference in vote percentage between the successful party and the second party.
- ↑ Previously the member for the abolished district of Queanbeyan.
- ↑ Previously the member for Sturt.
- ↑ Previously the member for Waverley.
- ↑ Previously the member for the abolished district of The Richmond.
- ↑ Previously the member for Northumberland.
- ↑ Previously the member for the abolished district of Belubula.
- ↑ John Gillies (Independent Liberal) died in 1911. The by-election in October 1911 was won by Charles Nicholson (Liberal Reform) who retained the seat at the 1913 general election.
- ↑ Previously the member for the abolished district of Waratah.
References
- 1 2 Green, Antony. "1913 election totals". New South Wales Election Results 1856-2007. Parliament of New South Wales. Retrieved 18 September 2019.
- ↑ "Part 5B alphabetical list of all electorates and Members since 1856" (PDF). NSW Parliamentary Record. Parliament of New South Wales. Retrieved 20 April 2020.
- ↑ "Former members of the New South Wales Parliament, 1856–2006". New South Wales Parliament. Retrieved 4 December 2019.
- ↑ "1904 Redistribution". Atlas of New South Wales. NSW Land & Property Information. Archived from the original on 23 June 2015.

