| |||||||||||||||||||||||||||||||||||||||||||||||||||||||||||||||||||||
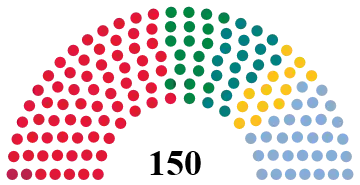
All 150 seats in the Norwegian Parliament 76 seats were needed for a majority | |||||||||||||||||||||||||||||||||||||||||||||||||||||||||||||||||||||
|---|---|---|---|---|---|---|---|---|---|---|---|---|---|---|---|---|---|---|---|---|---|---|---|---|---|---|---|---|---|---|---|---|---|---|---|---|---|---|---|---|---|---|---|---|---|---|---|---|---|---|---|---|---|---|---|---|---|---|---|---|---|---|---|---|---|---|---|---|---|
| |||||||||||||||||||||||||||||||||||||||||||||||||||||||||||||||||||||
| |||||||||||||||||||||||||||||||||||||||||||||||||||||||||||||||||||||
Parliamentary elections were held in Norway on 12 and 13 September 1965.[1] The Labour Party remained the largest party, winning 68 of the 150 seats. However, the four non-socialist parties succeeded in winning a majority between them and forming a government. Per Borten, the leader of the Centre Party, became Prime Minister.
Campaign
Political parties
| Name | Ideology | Position | Leader | 1961 result | |||
|---|---|---|---|---|---|---|---|
| Votes (%) | Seats | ||||||
| Ap | Labour Party Arbeiderpartiet |
Social democracy | Centre-left | Einar Gerhardsen | 46.7% | 74 / 150 | |
| H | Conservative Party Høyre |
Conservatism | Centre-right | John Lyng | 19.2% | 28 / 150 | |
| KrF | Christian Democratic Party Kristelig Folkeparti |
Christian democracy | Centre to centre-right | Einar Hareide | 9.3% | 14 / 150 | |
| V | Liberal Party Venstre |
Social liberalism | Centre | Gunnar Garbo | 7.2% | 11 / 150 | |
| Sp | Centre Party Senterpartiet |
Agrarianism | Centre | Per Borten | 6.8% | 11 / 150 | |
| NKP | Communist Party of Norway Norges Kommunistiske Parti |
Communism | Far-left | Reidar T. Larsen | 2.9% | 0 / 155 | |
| SF | Socialist People's Party Sosialistisk Folkeparti |
Socialism | Left-wing to Far-left | Knut Løfsnes | 2.3% | 2 / 150 | |
Results
 | |||||
|---|---|---|---|---|---|
| Party | Votes | % | Seats | +/– | |
| Labour Party | 883,320 | 43.14 | 68 | –6 | |
| Conservative Party | 415,612 | 20.30 | 30 | +2 | |
| Liberal Party | 207,834 | 10.15 | 18 | +4 | |
| Centre Party | 191,702 | 9.36 | 17 | +2 | |
| Christian Democratic Party | 160,331 | 7.83 | 12 | –2 | |
| Socialist People's Party | 122,721 | 5.99 | 2 | 0 | |
| Communist Party | 27,996 | 1.37 | 0 | 0 | |
| Christians–Conservatives[lower-alpha 1] | 22,800 | 1.11 | 2 | – | |
| Centrists–Liberals[lower-alpha 2] | 14,713 | 0.72 | 1 | – | |
| Democratic Party | 194 | 0.01 | 0 | New | |
| Freedom Protectors | 163 | 0.01 | 0 | New | |
| Wild votes | 8 | 0.00 | – | – | |
| Total | 2,047,394 | 100.00 | 150 | 0 | |
| Valid votes | 2,047,394 | 99.58 | |||
| Invalid/blank votes | 8,697 | 0.42 | |||
| Total votes | 2,056,091 | 100.00 | |||
| Registered voters/turnout | 2,406,866 | 85.43 | |||
| Source: Nohlen & Stöver | |||||
Seat distribution
| Constituency | Total seats |
Seats won | |||||
|---|---|---|---|---|---|---|---|
| Ap | H | V | Sp | KrF | SF | ||
| Akershus | 7 | 3 | 2 | 1 | 1 | ||
| Aust-Agder | 4 | 2 | 1 | 1 | |||
| Bergen | 5 | 2 | 1 | 1 | 1 | ||
| Buskerud | 7 | 4 | 2 | 1 | |||
| Finnmark | 4 | 3 | 1 | ||||
| Hedmark | 8 | 5 | 1 | 2 | |||
| Hordaland | 10 | 3 | 2 | 2 | 1 | 2 | |
| Møre og Romsdal | 10 | 3 | 1 | 2 | 2 | 2 | |
| Nord-Trøndelag | 6 | 3 | 1 | 2 | |||
| Nordland | 12 | 6 | 2 | 1 | 1 | 1 | 1 |
| Oppland | 7 | 4 | 1 | 2 | |||
| Oslo | 13 | 6 | 5 | 1 | 1 | ||
| Østfold | 8 | 4 | 2 | 1 | 1 | ||
| Rogaland | 10 | 3 | 2 | 2 | 1 | 2 | |
| Sogn og Fjordane | 5 | 1 | 1 | 1 | 1 | 1 | |
| Sør-Trøndelag | 10 | 5 | 2 | 1 | 1 | 1 | |
| Telemark | 6 | 3 | 1 | 1 | 1 | ||
| Troms | 6 | 3 | 1 | 1 | 1 | ||
| Vest-Agder | 5 | 2 | 1 | 1 | 1 | ||
| Vestfold | 7 | 3 | 2 | 1 | 1 | ||
| Total | 150 | 68 | 31 | 18 | 18 | 13 | 2 |
| Source: Norges Offisielle Statistikk | |||||||
Notes
References
- ↑ Dieter Nohlen & Philip Stöver (2010) Elections in Europe: A data handbook, p1438 ISBN 978-3-8329-5609-7
- 1 2 Nohlen & Stöver, pp1459-1460
This article is issued from Wikipedia. The text is licensed under Creative Commons - Attribution - Sharealike. Additional terms may apply for the media files.

.JPG.webp)

.jpg.webp)