| |||||||||||||||||||||||||||||||||||||||||||||||||||||||||||||||||||||||||||||||||||||||||||||||||
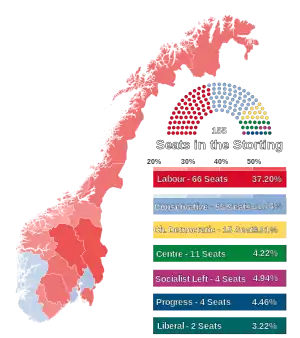
All 155 seats in the Storting 78 seats needed for a majority | |||||||||||||||||||||||||||||||||||||||||||||||||||||||||||||||||||||||||||||||||||||||||||||||||
|---|---|---|---|---|---|---|---|---|---|---|---|---|---|---|---|---|---|---|---|---|---|---|---|---|---|---|---|---|---|---|---|---|---|---|---|---|---|---|---|---|---|---|---|---|---|---|---|---|---|---|---|---|---|---|---|---|---|---|---|---|---|---|---|---|---|---|---|---|---|---|---|---|---|---|---|---|---|---|---|---|---|---|---|---|---|---|---|---|---|---|---|---|---|---|---|---|---|
| |||||||||||||||||||||||||||||||||||||||||||||||||||||||||||||||||||||||||||||||||||||||||||||||||
 Results by county | |||||||||||||||||||||||||||||||||||||||||||||||||||||||||||||||||||||||||||||||||||||||||||||||||
| |||||||||||||||||||||||||||||||||||||||||||||||||||||||||||||||||||||||||||||||||||||||||||||||||

.JPG.webp)
.jpg.webp)


Parliamentary elections were held in Norway on 13 and 14 September 1981.[1] The Labour Party remained the largest party in the Storting, winning 66 of the 155 seats. The Conservative Party made the strongest gains and formed a government on its own. In 1983 a majority coalition government with the Christian People's Party and the Centre Party was established.
Campaign
Political parties
| Name | Ideology | Position | Leader | 1977 result | |||
|---|---|---|---|---|---|---|---|
| Votes (%) | Seats | ||||||
| Ap | Labour Party Arbeiderpartiet |
Social democracy | Centre-left | Gro Harlem Brundtland | 42.2% | 76 / 155 | |
| H | Conservative Party Høyre |
Conservatism | Centre-right | Jo Benkow | 24.5% | 40 / 155 | |
| KrF | Christian Democratic Party Kristelig Folkeparti |
Christian democracy | Centre to centre-right | Kåre Kristiansen | 9.7% | 18 / 155 | |
| Sp | Centre Party Senterpartiet |
Agrarianism | Centre | Johan J. Jakobsen | 8.0% | 11 / 155 | |
| SV | Socialist Left Party Sosialistisk Venstreparti |
Democratic socialism | Left-wing | Berge Furre | 4.1% | 2 / 155 | |
| V | Liberal Party Venstre |
Social liberalism | Centre | Hans Hammond Rossbach | 2.3% | 1 / 155 | |
| FrP | Progress Party Fremskrittspartiet |
Classical liberalism | Right-wing | Carl I. Hagen | 1.8% | 0 / 155 | |
Debates
| 1981 Norwegian general election debates | |||||||||||||
|---|---|---|---|---|---|---|---|---|---|---|---|---|---|
| Date | Time | Organizers | P Present I Invitee N Non-invitee | ||||||||||
| Ap | H | KrF | Sp | Sv | V | Frp | Dlp | NKP | R | Refs | |||
| 11 Sep | 00:00 | NRK | P Einar Førde, Gro Harlem Brundtland |
P Kåre Willoch |
P Kåre Kristiansen |
P Johan J. Jakobsen |
P Hanna Kvanmo |
P Hans Hammond Rossbach |
P Carl I. Hagen |
P Gerd Søraa |
P Martin Gunnar Knutsen |
P Sigurd Allern |
[2] |
Results
 | |||||
|---|---|---|---|---|---|
| Party | Votes | % | Seats | +/– | |
| Labour Party | 914,749 | 37.20 | 66 | –10 | |
| Conservative Party | 780,372 | 31.74 | 53 | +12 | |
| Christian Democratic Party | 219,179 | 8.91 | 15 | –7 | |
| Socialist Left Party | 121,561 | 4.94 | 4 | +2 | |
| Progress Party | 109,564 | 4.46 | 4 | +4 | |
| Centre Party | 103,753 | 4.22 | 6 | –1 | |
| Non-socialist joint lists[lower-alpha 1] | 88,969 | 3.62 | 5 | – | |
| Liberal Party | 79,064 | 3.22 | 2 | 0 | |
| Red Electoral Alliance | 17,844 | 0.73 | 0 | 0 | |
| Liberal People's Party | 13,344 | 0.54 | 0 | 0 | |
| Communist Party | 6,673 | 0.27 | 0 | 0 | |
| Plebiscite Party | 1,145 | 0.05 | 0 | New | |
| Tom A. Schanke's Party | 826 | 0.03 | 0 | New | |
| Freely Elected Representatives | 801 | 0.03 | 0 | 0 | |
| Lapp People's List | 594 | 0.02 | 0 | 0 | |
| Broad-Based Non-Partisan List | 383 | 0.02 | 0 | New | |
| Total | 2,458,821 | 100.00 | 155 | 0 | |
| Valid votes | 2,458,821 | 99.86 | |||
| Invalid/blank votes | 3,387 | 0.14 | |||
| Total votes | 2,462,208 | 100.00 | |||
| Registered voters/turnout | 3,003,093 | 81.99 | |||
| Source: Nohlen & Stöver | |||||
Seat distribution
| Constituency | Total seats |
Seats won | ||||||
|---|---|---|---|---|---|---|---|---|
| Ap | H | KrF | Sp | SV | Frp | V | ||
| Akershus | 10 | 4 | 5 | 1 | ||||
| Aust-Agder | 4 | 2 | 1 | 1 | ||||
| Buskerud | 7 | 4 | 2 | 1 | ||||
| Finnmark | 4 | 3 | 1 | |||||
| Hedmark | 8 | 5 | 2 | 1 | ||||
| Hordaland | 15 | 4 | 5 | 2 | 1 | 1 | 1 | 1 |
| Møre og Romsdal | 10 | 3 | 3 | 2 | 1 | 1 | ||
| Nord-Trøndelag | 6 | 3 | 1 | 2 | ||||
| Nordland | 12 | 5 | 4 | 1 | 1 | 1 | ||
| Oppland | 7 | 4 | 2 | 1 | ||||
| Oslo | 15 | 5 | 7 | 1 | 1 | 1 | ||
| Østfold | 8 | 4 | 3 | 1 | ||||
| Rogaland | 10 | 3 | 3 | 2 | 1 | 1 | ||
| Sogn og Fjordane | 5 | 2 | 1 | 1 | 1 | |||
| Sør-Trøndelag | 10 | 4 | 3 | 1 | 1 | 1 | ||
| Telemark | 6 | 3 | 2 | 1 | ||||
| Troms | 6 | 3 | 2 | 1 | ||||
| Vest-Agder | 5 | 2 | 2 | 1 | ||||
| Vestfold | 7 | 3 | 4 | |||||
| Total | 155 | 66 | 53 | 15 | 11 | 4 | 4 | 2 |
| Source: Norges Offisielle Statistikk | ||||||||
Notes
References
- ↑ Dieter Nohlen & Philip Stöver (2010) Elections in Europe: A data handbook, p1438 ISBN 978-3-8329-5609-7
- ↑ "Partilederdebatt, Partilederne i valgkampinnspurten foran Stortingsvalget 1981". 11 September 1981.
- ↑ Nohlen & Stöver, p1460
| Parliamentary elections |
|
|---|---|
| Local elections | |
| Sámi elections | |
| Referendums | |
This article is issued from Wikipedia. The text is licensed under Creative Commons - Attribution - Sharealike. Additional terms may apply for the media files.