| ||||||||||||||||||||||||||||
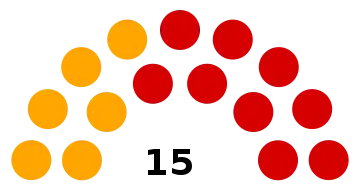
All 15 seats in the House of Representatives 8 seats needed for a majority | ||||||||||||||||||||||||||||
|---|---|---|---|---|---|---|---|---|---|---|---|---|---|---|---|---|---|---|---|---|---|---|---|---|---|---|---|---|
| ||||||||||||||||||||||||||||
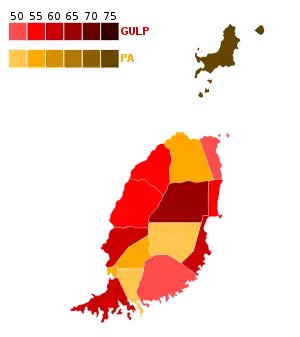
 Results by constituency | ||||||||||||||||||||||||||||
| ||||||||||||||||||||||||||||
 |
|---|
| Administrative divisions (parishes) |
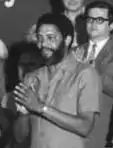
General elections were held in Grenada on 7 December 1976.[1] The result was a victory for the Grenada United Labour Party of Eric Gairy, which won nine of the 15 seats, whilst the opposition People's Alliance (a coalition of the New Jewel Movement, the Grenada National Party and the United People's Party) won the remainder. However, the elections were marred by fraud (and branded fraudulent by international observers), as Gairy's secret police, known as the Mongoose Gang, had been threatening the opposition.[2] Voter turnout was 65.2%.[3]
Three years later Gairy was overthrown by the New Jewel Movement, a move which was supported by the majority of the population.[4]
Results
 | |||||
|---|---|---|---|---|---|
| Party | Votes | % | Seats | +/– | |
| Grenada United Labour Party | 21,108 | 51.74 | 9 | –4 | |
| People's Alliance (NJM–NP–GPP) | 18,886 | 46.29 | 6 | +4 | |
| Independents | 803 | 1.97 | 0 | New | |
| Total | 40,797 | 100.00 | 15 | 0 | |
| Valid votes | 40,797 | 99.03 | |||
| Invalid/blank votes | 399 | 0.97 | |||
| Total votes | 41,196 | 100.00 | |||
| Registered voters/turnout | 63,193 | 65.19 | |||
| Source: Nohlen | |||||
References
This article is issued from Wikipedia. The text is licensed under Creative Commons - Attribution - Sharealike. Additional terms may apply for the media files.

