| |||||||||||||||||||||||||||||||||||||||||||||||||||||||||||||||||
All 15 seats in the House of Representatives 8 seats needed for a majority | |||||||||||||||||||||||||||||||||||||||||||||||||||||||||||||||||
|---|---|---|---|---|---|---|---|---|---|---|---|---|---|---|---|---|---|---|---|---|---|---|---|---|---|---|---|---|---|---|---|---|---|---|---|---|---|---|---|---|---|---|---|---|---|---|---|---|---|---|---|---|---|---|---|---|---|---|---|---|---|---|---|---|---|
| Turnout | 68.42% | ||||||||||||||||||||||||||||||||||||||||||||||||||||||||||||||||
| |||||||||||||||||||||||||||||||||||||||||||||||||||||||||||||||||
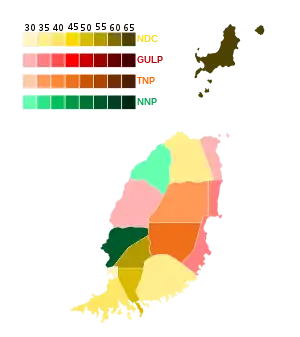 Winning party by constituency | |||||||||||||||||||||||||||||||||||||||||||||||||||||||||||||||||
| |||||||||||||||||||||||||||||||||||||||||||||||||||||||||||||||||


 |
|---|
| Administrative divisions (parishes) |
General elections were held in Grenada on 13 March 1990.[1] The result was a victory for the National Democratic Congress, which won seven of the 15 seats. Voter turnout was 68.4%.[2]
Results
| Party | Votes | % | Seats | +/– | |
|---|---|---|---|---|---|
| National Democratic Congress | 13,637 | 34.55 | 7 | New | |
| Grenada United Labour Party | 11,105 | 28.13 | 4 | +3 | |
| New National Party | 6,916 | 17.52 | 2 | –12 | |
| The National Party | 6,854 | 17.36 | 2 | New | |
| Maurice Bishop Patriotic Movement | 938 | 2.38 | 0 | 0 | |
| Good Old Democratic Party | 6 | 0.02 | 0 | New | |
| Independents | 15 | 0.04 | 0 | 0 | |
| Total | 39,471 | 100.00 | 15 | 0 | |
| Valid votes | 39,471 | 98.83 | |||
| Invalid/blank votes | 468 | 1.17 | |||
| Total votes | 39,939 | 100.00 | |||
| Registered voters/turnout | 58,374 | 68.42 | |||
| Source: Nohlen | |||||
References
| General elections | |
|---|---|
| West Indies elections | |
| Referendums | |
This article is issued from Wikipedia. The text is licensed under Creative Commons - Attribution - Sharealike. Additional terms may apply for the media files.