| |||||||||||||||||||||||||||||||||||||||||||||||||||||||||||||
All 46 seats to Fife Regional Council 24 seats needed for a majority | |||||||||||||||||||||||||||||||||||||||||||||||||||||||||||||
|---|---|---|---|---|---|---|---|---|---|---|---|---|---|---|---|---|---|---|---|---|---|---|---|---|---|---|---|---|---|---|---|---|---|---|---|---|---|---|---|---|---|---|---|---|---|---|---|---|---|---|---|---|---|---|---|---|---|---|---|---|---|
| |||||||||||||||||||||||||||||||||||||||||||||||||||||||||||||
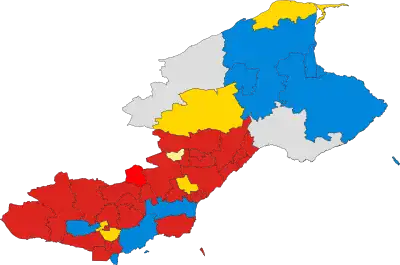 Results by electoral division. | |||||||||||||||||||||||||||||||||||||||||||||||||||||||||||||
| |||||||||||||||||||||||||||||||||||||||||||||||||||||||||||||
The third election to Fife Regional Council was held on 6 May 1982 as part of the wider 1982 Scottish regional elections. The election saw Labour maintaining their control of the region's 46-seat council.
Aggregate results
| Party | Seats | Gains | Losses | Net gain/loss | Seats % | Votes % | Votes | +/− | |
|---|---|---|---|---|---|---|---|---|---|
| Labour | 27 | 60.0 | 40.4 | 42,549 | |||||
| Conservative | 10 | 22.2 | 19.6 | 20,594 | |||||
| Alliance | 4 | 4 | 0 | 4 | 8.9 | 21.2 | 22,348 | ||
| Independent | 2 | 4.4 | 5.9 | 6,161 | |||||
| SNP | 1 | 2.2 | 9.8 | 10,271 | |||||
| Communist | 1 | 0 | 0 | 0 | 2.2 | 2.9 | 3,021 | ||
| Democratic Socialist Party | 0 | 0 | 0 | 0 | 0.0 | 0.3 | 264 | New | |
References
| London boroughs |
|
|---|---|
| Metropolitan boroughs |
|
| District councils (England) |
|
| Regional councils (Scotland) | |
This article is issued from Wikipedia. The text is licensed under Creative Commons - Attribution - Sharealike. Additional terms may apply for the media files.