| |||||||||||||||||||||||||||||||||
14 of the 42 seats to Harlow District Council 23 seats needed for a majority | |||||||||||||||||||||||||||||||||
|---|---|---|---|---|---|---|---|---|---|---|---|---|---|---|---|---|---|---|---|---|---|---|---|---|---|---|---|---|---|---|---|---|---|
| |||||||||||||||||||||||||||||||||
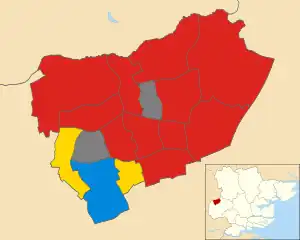 Map showing the results of contested wards in the 1982 Harlow District Council elections. | |||||||||||||||||||||||||||||||||
| |||||||||||||||||||||||||||||||||
The 1982 Harlow District Council election took place on 6 May 1982 to elect members of Harlow District Council in Essex, England. This was on the same day as other local elections. The Labour Party retained control of the council.
Election result
| Party | Seats | Gains | Losses | Net gain/loss | Seats % | Votes % | Votes | +/− | |
|---|---|---|---|---|---|---|---|---|---|
| Labour | 11 | 1 | 1 | 78.6 | 50.3 | 11,274 | |||
| Alliance | 2 | 1 | 0 | 14.3 | 37.0 | 8,299 | |||
| Conservative | 1 | 1 | 2 | 7.1 | 12.5 | 2,800 | |||
| Independent Liberal | 0 | 0 | 0 | 0.0 | 0.2 | 52 | New | ||
All comparisons in vote share are to the corresponding 1978 election.
Ward results
Brays Grove

Location of Brays Grove ward
| Party | Candidate | Votes | % | |
|---|---|---|---|---|
| Labour | D. Howard | 793 | 55.7% | |
| Conservative | H. Willcox | 630 | 44.3% | |
| Turnout | 41.8% | |||
| Labour hold | ||||
Hare Street and Town Centre

Location of Hare Street and Town Centre ward
| Party | Candidate | Votes | % | |
|---|---|---|---|---|
| Labour | J. Cramp | 764 | 56.2% | |
| Alliance | C. Merryweather | 596 | 43.8% | |
| Turnout | 43.9% | |||
| Labour hold | ||||
Katherines With Sumner

Location of Katherines with Sumner ward
| Party | Candidate | Votes | % | |
|---|---|---|---|---|
| Alliance | P. Davis | 943 | 49.7% | |
| Labour | A. Evans | 672 | 35.4% | |
| Conservative | M. Tombs | 284 | 15.0% | |
| Turnout | 44.8% | |||
| Alliance gain from Conservative | ||||
Kingsmoor

Location of Kingsmoor ward
| Party | Candidate | Votes | % | |
|---|---|---|---|---|
| Conservative | L. Atkins | 840 | 43.0% | |
| Labour | R. Rowland | 709 | 36.3% | |
| Alliance | D. Harris | 404 | 20.7% | |
| Turnout | 41.4% | |||
| Conservative gain from Labour | ||||
Latton Bush

Location of Latton Bush ward
| Party | Candidate | Votes | % | |
|---|---|---|---|---|
| Labour | S. Edwards | 953 | 50.7% | |
| Conservative | K. Clarke | 506 | 26.9% | |
| Alliance | T. McArdle | 421 | 22.4% | |
| Turnout | 43.8% | |||
| Labour hold | ||||
Little Parndon
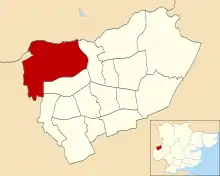
Location of Little Parndon ward
| Party | Candidate | Votes | % | |
|---|---|---|---|---|
| Labour | M. Carter | 1,025 | 58.9% | |
| Alliance | R. Baskett | 715 | 41.1% | |
| Turnout | 40.5% | |||
| Labour hold | ||||
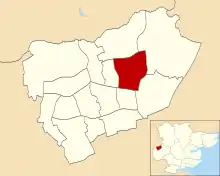
Mark Hall North

Location of Mark Hall North ward
| Party | Candidate | Votes | % | |
|---|---|---|---|---|
| Labour | E. Morris | 545 | 44.3% | |
| Conservative | N. Armitage | 414 | 33.7% | |
| Alliance | P. Moulds | 271 | 22.0% | |
| Turnout | 51.4% | |||
| Labour hold | ||||
Mark Hall South
Location of Mark Hall South ward
| Party | Candidate | Votes | % | |
|---|---|---|---|---|
| Labour | S. Anderson | 961 | 58.2% | |
| Conservative | G. Dabnor | 403 | 24.4% | |
| Alliance | S. Tucker | 286 | 17.3% | |
| Turnout | 40.7% | |||
| Labour hold | ||||
Netteswell West
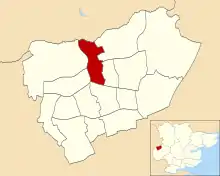
Location of Netteswell West ward
| Party | Candidate | Votes | % | |
|---|---|---|---|---|
| Labour | M. Gerrard | 537 | 54.5% | |
| Alliance | R. Freeman | 312 | 31.6% | |
| Conservative | F. Burgoyne | 137 | 13.9% | |
| Turnout | 39.7% | |||
| Labour hold | ||||
Old Harlow

Location of Old Harlow ward
| Party | Candidate | Votes | % | |
|---|---|---|---|---|
| Labour | S. Firth | 1,060 | 49.4% | |
| Conservative | S. Rigden | 561 | 26.2% | |
| Alliance | R. Winkie | 472 | 22.0% | |
| Independent Liberal | S. Ward | 52 | 2.4% | |
| Turnout | 47.1% | |||
| Labour gain from Conservative | ||||
Passmores

Location of Passmores ward
| Party | Candidate | Votes | % | |
|---|---|---|---|---|
| Labour | M. Collyer | 825 | 51.3% | |
| Alliance | D. Filler | 782 | 48.7% | |
| Turnout | 38.1% | |||
| Labour hold | ||||
Potter Street

Location of Potter Street ward
| Party | Candidate | Votes | % | |
|---|---|---|---|---|
| Labour | R. Bruce | 900 | 66.0% | |
| Alliance | P. Murray | 464 | 34.0% | |
| Turnout | 41.5% | |||
| Labour hold | ||||
Stewards

Location of Stewards ward
| Party | Candidate | Votes | % | |
|---|---|---|---|---|
| Alliance | P. McCallion | 1,121 | 69.5% | |
| Labour | K. Ion | 491 | 30.5% | |
| Turnout | 40.6% | |||
| Alliance hold | ||||
Tye Green

Location of Tye Green ward
| Party | Candidate | Votes | % | |
|---|---|---|---|---|
| Labour | W. Hanley | 1,039 | 65.9% | |
| Alliance | S. James | 537 | 34.1% | |
| Turnout | 39.7% | |||
| Labour hold | ||||
References
| London boroughs |
|
|---|---|
| Metropolitan boroughs |
|
| District councils (England) |
|
| Regional councils (Scotland) | |
This article is issued from Wikipedia. The text is licensed under Creative Commons - Attribution - Sharealike. Additional terms may apply for the media files.