| |||||||||||||||||||||||||||||||||
13 of the 39 seats to Stevenage Borough Council 20 seats needed for a majority | |||||||||||||||||||||||||||||||||
|---|---|---|---|---|---|---|---|---|---|---|---|---|---|---|---|---|---|---|---|---|---|---|---|---|---|---|---|---|---|---|---|---|---|
| |||||||||||||||||||||||||||||||||
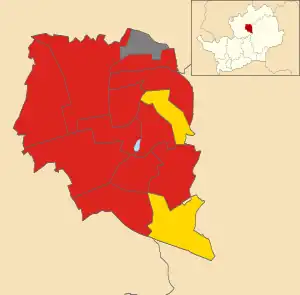 Map showing the results of contested wards in the 1984 Stevenage Borough Council elections. | |||||||||||||||||||||||||||||||||
| |||||||||||||||||||||||||||||||||
The 1984 Stevenage Borough Council election took place on 3 May 1984. This was on the same day as other local elections. One third of the council was up for election; the seats which were last contested in 1980. The Labour Party retained control of the council, which it had held continuously since its creation in 1973.
Overall results
| Party | Seats | Gains | Losses | Net gain/loss | Seats % | Votes % | Votes | +/− | ||
|---|---|---|---|---|---|---|---|---|---|---|
| Labour | 11 | 0 | 1 | 84.6 | 47.8 | 11,138 | ||||
| Alliance | 2 | 1 | 0 | 15.4 | 28.1 | 6,545 | ||||
| Conservative | 0 | 0 | 0 | 0.0 | 24.1 | 5,618 | ||||
| Total | 13 | 20,523 | ||||||||
| Labour hold | ||||||||||
All comparisons in vote share are to the corresponding 1980 election.
Ward results
Bandley Hill
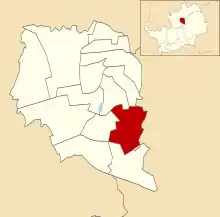
Location of Bandley Hill
| Party | Candidate | Votes | % | |
|---|---|---|---|---|
| Labour | Woodward | 1,113 | 62.2% | |
| Alliance | Warr | 403 | 22.5% | |
| Conservative | Kolinski | 273 | 15.3% | |
| Turnout | 37.0% | |||
| Labour hold | ||||
Bedwell Plash
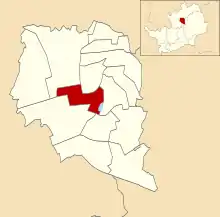
Location of Bedwell Plash ward
| Party | Candidate | Votes | % | |
|---|---|---|---|---|
| Labour | M. Downing | 1,200 | 61.5% | |
| Conservative | Percival | 394 | 20.2% | |
| Alliance | Atkins | 356 | 18.3% | |
| Turnout | 47.0% | |||
| Labour hold | ||||
Chells
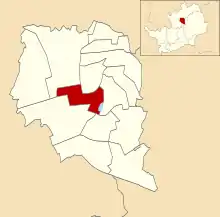
Location of Chells ward
| Party | Candidate | Votes | % | |
|---|---|---|---|---|
| Labour | K. Vale | 812 | 54.3% | |
| Alliance | Batley | 350 | 23.4% | |
| Conservative | Blanchette | 333 | 22.3% | |
| Turnout | 44.3% | |||
| Labour hold | ||||
Longmeadow
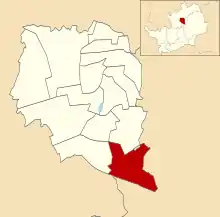
Location of Longmeadow ward
| Party | Candidate | Votes | % | |
|---|---|---|---|---|
| Alliance | Boutell | 902 | 40.1% | |
| Labour | J. Tye | 761 | 33.8% | |
| Conservative | H. Grant | 586 | 26.1% | |
| Turnout | 45.0% | |||
| Alliance gain from Labour | ||||
Martins Wood
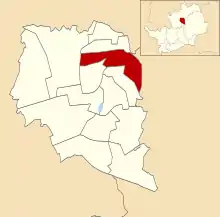
Location of Martins Wood ward
| Party | Candidate | Votes | % | |
|---|---|---|---|---|
| Labour | Drake | 694 | 39.0% | |
| Alliance | Akhurst | 674 | 37.9% | |
| Conservative | M. Mason | 411 | 23.1% | |
| Turnout | 32.3% | |||
| Labour hold | ||||
Mobbsbury
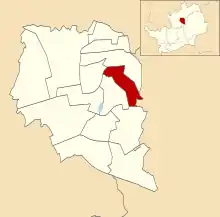
Location of Mobbsbury ward
| Party | Candidate | Votes | % | |
|---|---|---|---|---|
| Alliance | Neal | 785 | 40.6% | |
| Labour | Dunnell | 736 | 38.1% | |
| Conservative | G. Smith | 411 | 21.3% | |
| Turnout | 54.1% | |||
| Alliance gain from Labour | ||||
Monkswood
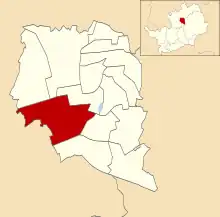
Location of Monkswood ward
| Party | Candidate | Votes | % | |
|---|---|---|---|---|
| Labour | B. Jackson | 746 | 64.9% | |
| Conservative | R. Edwards | 215 | 18.7% | |
| Alliance | Ffinch | 188 | 16.4% | |
| Turnout | 45.1% | |||
| Labour hold | ||||
Old Stevenage
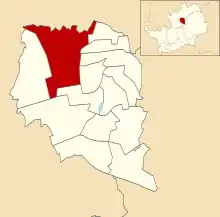
Location of Old Stevenage ward
| Party | Candidate | Votes | % | |
|---|---|---|---|---|
| Labour | H. Morris | 1,093 | 45.0% | |
| Conservative | D. Eaton | 1,007 | 41.5% | |
| Alliance | O'Callaghan | 327 | 13.5% | |
| Turnout | 47.1% | |||
| Labour hold | ||||
Pin Green
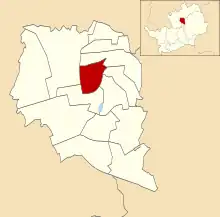
Location of Pin Green ward
| Party | Candidate | Votes | % | |
|---|---|---|---|---|
| Labour | A. Campbell | 868 | 49.5% | |
| Alliance | J. Lucioli | 480 | 27.4% | |
| Conservative | Portsmouth | 404 | 23.1% | |
| Turnout | 44.6% | |||
| Labour hold | ||||
Roebuck
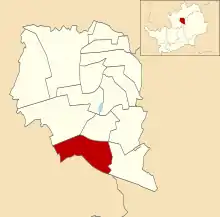
Location of Roebuck ward
| Party | Candidate | Votes | % | |
|---|---|---|---|---|
| Labour | F. Schofield | 781 | 45.1% | |
| Alliance | Edwards | 524 | 30.2% | |
| Conservative | McPartland | 428 | 24.7% | |
| Turnout | 40.7% | |||
| Labour hold | ||||
St Nicholas
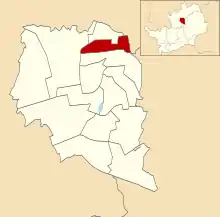
Location of St Nicholas ward
| Party | Candidate | Votes | % | |
|---|---|---|---|---|
| Labour | R. Fowler | 632 | 44.7% | |
| Alliance | J. Lucioli | 510 | 36.0% | |
| Conservative | S. Woods | 273 | 19.3% | |
| Turnout | 38.2% | |||
| Labour hold | ||||
Shephall
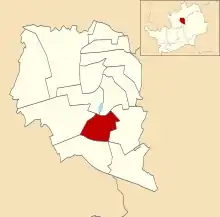
Location of Shephall ward
| Party | Candidate | Votes | % | |
|---|---|---|---|---|
| Labour | I. Johnson | 770 | 54.6% | |
| Alliance | Akhurst | 405 | 28.7% | |
| Conservative | Baillie | 236 | 16.7% | |
| Turnout | 39.4% | |||
| Labour hold | ||||
Symonds Green
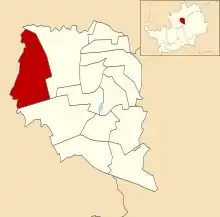
Location of Symonds Green ward
| Party | Candidate | Votes | % | |
|---|---|---|---|---|
| Labour | S. Munden | 932 | 42.0% | |
| Conservative | J. Halling | 674 | 30.4% | |
| Alliance | G. Balderstone | 614 | 27.7% | |
| Turnout | 41.5% | |||
| Labour hold | ||||
References
This article is issued from Wikipedia. The text is licensed under Creative Commons - Attribution - Sharealike. Additional terms may apply for the media files.