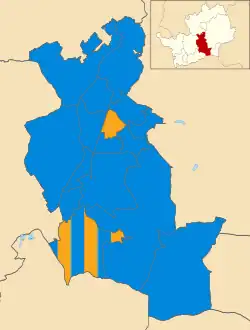
Map showing the results of the 2021 Welwyn Hatfield Borough Council election
Elections to Welwyn Hatfield Borough Council took place on 6 May 2021. This was on the same day as other local elections across the United Kingdom.[1]
Results summary
| 2021 Welwyn Hatfield Borough Council election | ||||||||||
|---|---|---|---|---|---|---|---|---|---|---|
| Party | This election | Full council | This election | |||||||
| Seats | Net | Seats % | Other | Total | Total % | Votes | Votes % | +/− | ||
| Conservative | 15 | 88.2 | 13 | 28 | 58.3 | 14,916 | 48.7 | +9.9 | ||
| Liberal Democrats | 2 | 11.8 | 9 | 11 | 22.9 | 6,576 | 21.5 | -10.7 | ||
| Labour | 0 | 0.0 | 9 | 9 | 18.8 | 7,370 | 24.0 | -1.4 | ||
| Green | 0 | 0.0 | 0 | 0 | 0.0 | 1,655 | 5.4 | +2.9 | ||
| Abolish the Town Council | 0 | 0.0 | 0 | 0 | 0.0 | 86 | 0.3 | New | ||
| For Britain | 0 | 0.0 | 0 | 0 | 0.0 | 42 | 0.1 | New | ||
Ward results
Brookmans Park and Little Heath
| Party | Candidate | Votes | % | ±% | |
|---|---|---|---|---|---|
| Conservative | Stephen Boulton | 1,559 | 73.2 | +5.4 | |
| Labour | Graham Beevers | 339 | 15.9 | +4.1 | |
| Liberal Democrats | Peter Basford | 232 | 10.9 | -9.5 | |
| Majority | 1,220 | 57.3 | +9.9 | ||
| Turnout | 2,130 | 42.3 | +4.8 | ||
| Conservative hold | Swing | ||||
Haldens
| Party | Candidate | Votes | % | ±% | |
|---|---|---|---|---|---|
| Conservative | Alastair Hellyer | 766 | 43.7 | +7.9 | |
| Labour | Mike Larkins | 589 | 33.6 | +1.2 | |
| Liberal Democrats | Rhiannon Richardson | 245 | 14.0 | -7.5 | |
| Green | Sarah Butcher | 153 | 8.7 | -1.6 | |
| Majority | 177 | 10.1 | +6.9 | ||
| Turnout | 1,753 | 36.0 | +3.6 | ||
| Conservative gain from Labour | Swing | ||||
Handside
| Party | Candidate | Votes | % | ±% | |
|---|---|---|---|---|---|
| Conservative | Fiona Thomson | 1,317 | 46.3 | +20.0 | |
| Liberal Democrats | Gemma Moore | 1,003 | 35.3 | -23.4 | |
| Labour | Helen Beckett | 316 | 11.1 | +3.1 | |
| Green | Ian Nendick | 208 | 7.3 | +0.3 | |
| Majority | 314 | 11.0 | — | ||
| Turnout | 2,844 | 52.2 | +5.4 | ||
| Conservative hold | Swing | ||||
Hatfield Central
| Party | Candidate | Votes | % | ±% | |
|---|---|---|---|---|---|
| Conservative | James Bond | 580 | 42.7 | +9.0 | |
| Labour | Maureen Cook | 571 | 42.0 | -3.1 | |
| Liberal Democrats | Michelle Kirk | 122 | 9.0 | -12.2 | |
| Abolish the Town Council | Melvyn Jones | 86 | 6.3 | N/A | |
| Majority | 9 | 0.7 | — | ||
| Turnout | 2,844 | 25.1 | +0.8 | ||
| Conservative gain from Labour | Swing | ||||
Hatfield East
| Party | Candidate | Votes | % | ±% | |
|---|---|---|---|---|---|
| Conservative | James Lake | 810 | 44.6 | +9.2 | |
| Labour | Cathy Watson | 552 | 30.4 | +4.8 | |
| Liberal Democrats | Richard Snowdon | 289 | 15.9 | -15.5 | |
| Green | Ian Gregory | 165 | 9.1 | +0.2 | |
| Majority | 258 | 14.2 | — | ||
| Turnout | 1,816 | 32.5 | -0.7 | ||
| Conservative hold | Swing | ||||
Hatfield South West
| Party | Candidate | Votes | % | ±% | |
|---|---|---|---|---|---|
| Conservative | Craig Stanbury | 526 | 33.9 | +9.1 | |
| Labour | James Broach | 515 | 33.2 | -6.4 | |
| Liberal Democrats | Timothy Rowse | 510 | 32.9 | +6.0 | |
| Majority | 11 | 0.7 | — | ||
| Turnout | 1,551 | 28.7 | +0.8 | ||
| Conservative gain from Labour | Swing | ||||
Hatfield Villages
| Party | Candidate | Votes | % | ±% | |
|---|---|---|---|---|---|
| Conservative | Samuel Kasumu | 774 | 45.6 | +0.3 | |
| Labour | Margaret Eames-Petersen | 585 | 34.4 | -5.3 | |
| Liberal Democrats | Adam Edwards | 190 | 11.2 | -3.9 | |
| Green | Andreas Kukol | 150 | 8.8 | N/A | |
| Majority | 189 | 11.2 | +5.6 | ||
| Turnout | 1,699 | 31.4 | +4.2 | ||
| Conservative hold | Swing | ||||
Hollybush
| Party | Candidate | Votes | % | ±% | |
|---|---|---|---|---|---|
| Conservative | Nick Pace | 653 | 42.9 | +4.9 | |
| Labour | Mbizo Mpofu | 583 | 38.3 | -9.6 | |
| Liberal Democrats | Christopher Corbey-West | 148 | 9.7 | -4.4 | |
| Green | Claudia Ferlisi | 139 | 9.1 | N/A | |
| Majority | 70 | 4.6 | — | ||
| Turnout | 1,523 | 30.6 | +3.4 | ||
| Conservative hold | Swing | ||||
Howlands
| Party | Candidate | Votes | % | ±% | |
|---|---|---|---|---|---|
| Conservative | Steve McNamara | 962 | 52.5 | +19.9 | |
| Labour | Alan Chesterman | 680 | 37.1 | -6.3 | |
| Liberal Democrats | Konrad Basch | 190 | 10.4 | -1.5 | |
| Majority | 282 | 15.4 | — | ||
| Turnout | 1,832 | 34.3 | +3.5 | ||
| Conservative gain from Labour | Swing | ||||
Northaw and Cuffley
| Party | Candidate | Votes | % | ±% | |
|---|---|---|---|---|---|
| Conservative | Gail Ganney | 1,328 | 75.2 | +6.7 | |
| Labour | Sheila Barrett | 223 | 12.6 | +2.7 | |
| Liberal Democrats | Elizabeth Johnson | 215 | 12.2 | -10.5 | |
| Majority | 1,105 | 62.6 | +16.8 | ||
| Turnout | 1,766 | 37.2 | +5.4 | ||
| Conservative hold | Swing | ||||
Panshanger
| Party | Candidate | Votes | % | ±% | |
|---|---|---|---|---|---|
| Conservative | Stan Tunstall | 819 | 49.5 | +13.0 | |
| Liberal Democrats | Darrell Panter | 491 | 29.7 | -19.1 | |
| Labour | Joshua Chigwangwa | 343 | 20.8 | +6.1 | |
| Majority | 328 | 19.8 | — | ||
| Turnout | 1,653 | 36.9 | +0.4 | ||
| Conservative hold | Swing | ||||
Peartree
| Party | Candidate | Votes | % | ±% | |
|---|---|---|---|---|---|
| Liberal Democrats | Russ Platt | 578 | 40.4 | -10.0 | |
| Labour | Steve Iwasyk | 408 | 28.5 | -4.1 | |
| Conservative | Hamish Haddow | 336 | 23.5 | +6.5 | |
| Green | Nicola Chapman | 109 | 7.6 | N/A | |
| Majority | 170 | 11.9 | -5.9 | ||
| Turnout | 1,431 | 27.3 | +1.2 | ||
| Liberal Democrats hold | Swing | ||||
Sherrards
| Party | Candidate | Votes | % | ±% | |
|---|---|---|---|---|---|
| Conservative | Flavia Wachuku | 767 | 37.5 | +7.4 | |
| Liberal Democrats | Arvindkumar Thakkar | 575 | 28.1 | -18.4 | |
| Labour | Hilary Carlen | 477 | 23.3 | +10.9 | |
| Green | Lesley Smith | 228 | 11.1 | +5.6 | |
| Majority | 192 | 9.4 | — | ||
| Turnout | 2,047 | 46.0 | +1.8 | ||
| Conservative hold | Swing | ||||
Welham Green and Hatfield South
| Party | Candidate | Votes | % | ±% | |
|---|---|---|---|---|---|
| Liberal Democrats | Paul Zukowskyj | 791 | 50.5 | +3.5 | |
| Conservative | Teresa Travell | 727 | 46.4 | +14.5 | |
| Conservative | Paul Lowe | 543 | 34.7 | +2.8 | |
| Liberal Democrats | Richard Griffiths | 525 | 33.5 | -13.5 | |
| Labour | Gareth Aicken | 258 | 16.5 | -4.5 | |
| Labour | John Eames-Petersen | 245 | 15.6 | -5.4 | |
| For Britain | Mia Americanos-Molinaro | 42 | 2.7 | N/A | |
| Turnout | — | 34.2 | |||
| Liberal Democrats hold | Swing | ||||
| Conservative gain from Liberal Democrats | Swing | ||||
Welwyn East
| Party | Candidate | Votes | % | ±% | |
|---|---|---|---|---|---|
| Conservative | Julie Cragg | 1,218 | 56.3 | +4.9 | |
| Labour | Martine Davis | 425 | 19.7 | +0.2 | |
| Liberal Democrats | Helen Harrington | 278 | 12.9 | -16.1 | |
| Green | William Berrington | 241 | 11.1 | N/A | |
| Majority | 793 | 36.6 | +14.2 | ||
| Turnout | 2,162 | 42.2 | +6.7 | ||
| Conservative hold | Swing | ||||
Welwyn West
| Party | Candidate | Votes | % | ±% | |
|---|---|---|---|---|---|
| Conservative | Paul Smith | 1,231 | 63.5 | +8.0 | |
| Green | Penny Berrington | 262 | 13.5 | +6.5 | |
| Labour | Daniel Carlen | 251 | 13.0 | +6.5 | |
| Liberal Democrats | Alan Reimer | 194 | 10.0 | -21.0 | |
| Majority | 969 | 50.0 | +25.5 | ||
| Turnout | 1,938 | 39.8 | +2.6 | ||
| Conservative hold | Swing | ||||
References
- ↑ "Results for the County, Borough and Hatfield Town Council elections held on 6 May 2021". Welwyn Hatfield Borough Council. Retrieved 28 May 2021.
This article is issued from Wikipedia. The text is licensed under Creative Commons - Attribution - Sharealike. Additional terms may apply for the media files.