| |||||||||||||||||||||||||||||||||||||||||||||||||
23 of 66 seats (One Third and one by-election) to Wirral Metropolitan Borough Council 34 seats needed for a majority | |||||||||||||||||||||||||||||||||||||||||||||||||
|---|---|---|---|---|---|---|---|---|---|---|---|---|---|---|---|---|---|---|---|---|---|---|---|---|---|---|---|---|---|---|---|---|---|---|---|---|---|---|---|---|---|---|---|---|---|---|---|---|---|
| Turnout | 48.8% ( | ||||||||||||||||||||||||||||||||||||||||||||||||
| |||||||||||||||||||||||||||||||||||||||||||||||||
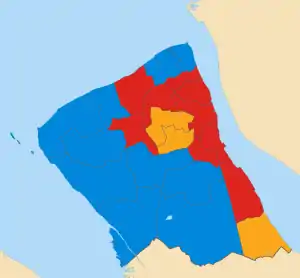
 Map of results of 1991 election | |||||||||||||||||||||||||||||||||||||||||||||||||
| |||||||||||||||||||||||||||||||||||||||||||||||||
The 1991 Wirral Metropolitan Borough Council election took place on 2 May 1991 to elect members of Wirral Metropolitan Borough Council in England.[2] This election was held on the same day as other local elections.
After the election, the composition of the council was:
| Party | Seats | ± | |
|---|---|---|---|
| Labour | 34 | ||
| Conservative | 24 | ||
| Liberal Democrats | 7 | ||
| Independent Labour | 1 | ||
Election results
Overall election result
Overall result compared with 1990.
| Wirral Metropolitan Borough Council election results, 1991 | |||||||||||||||
|---|---|---|---|---|---|---|---|---|---|---|---|---|---|---|---|
| Party | Candidates | Votes | |||||||||||||
| Stood | Elected | Gained | Unseated | Net | % of total | % | No. | Net % | |||||||
| Conservative | 23 | 11 | 2 | 1 | 45.5 | 43.6 | 54,489 | ||||||||
| Labour | 23 | 9 | 2 | 1 | 40.9 | 31.5 | 39,347 | ||||||||
| Liberal Democrats | 23 | 3 | 0 | 1 | 13.6 | 19.3 | 24,049 | ||||||||
| Green | 23 | 0 | 0 | 0 | 0.0 | 4.0 | 4,949 | ||||||||
| Independent Labour | 2 | 0 | 0 | 1 | 0.0 | 1.7 | 2,081 | N/A | |||||||
Ward results
Bebington
| Party | Candidate | Votes | % | ±% | |
|---|---|---|---|---|---|
| Conservative | Hilary Jones | 3,360 | 56.1 | ||
| Labour | Audrey Moore | 1,701 | 28.4 | ||
| Liberal Democrats | Kevin Turner | 698 | 11.7 | ||
| Green | T. Keen | 230 | 3.8 | ||
| Majority | 1,659 | 27.7 | |||
| Registered electors | 11,144 | ||||
| Turnout | 53.7 | ||||
| Conservative hold | Swing | ||||
Bidston
| Party | Candidate | Votes | % | ±% | |
|---|---|---|---|---|---|
| Labour | Harry Smith | 2,374 | 75.2 | ||
| Conservative | M. Vickers | 366 | 11.6 | ||
| Liberal Democrats | A. Molyneux | 287 | 9.1 | ||
| Green | Robert Mitchell | 129 | 4.1 | ||
| Majority | 2,008 | 63.6 | |||
| Registered electors | 8,842 | ||||
| Turnout | 35.7 | ||||
| Labour hold | Swing | ||||
Birkenhead
| Party | Candidate | Votes | % | ±% | |
|---|---|---|---|---|---|
| Labour | Phillip Davies | 2,610 | 71.0 | ||
| Conservative | J. Oliver | 490 | 13.3 | ||
| Liberal Democrats | Stephen Niblock | 404 | 11.0 | ||
| Green | Pamela Mitchell | 174 | 4.7 | ||
| Majority | 2,120 | 57.6 | |||
| Registered electors | 10,912 | ||||
| Turnout | 33.7 | ||||
| Labour hold | Swing | ||||
Bromborough
| Party | Candidate | Votes | % | ±% | |
|---|---|---|---|---|---|
| Labour | A. Rose | 2,291 | 43.4 | ||
| Conservative | S. Flynn | 1,822 | 34.5 | ||
| Liberal Democrats | L. Smith | 927 | 17.6 | ||
| Green | D. Hughes | 240 | 4.5 | ||
| Majority | 469 | 8.9 | |||
| Registered electors | 11,481 | ||||
| Turnout | 46.0 | ||||
| Labour hold | Swing | ||||
Clatterbridge
| Party | Candidate | Votes | % | ±% | |
|---|---|---|---|---|---|
| Conservative | Leonard Moore | 4,341 | 60.7 | ||
| Labour | T. Collins | 1,286 | 18.0 | ||
| Liberal Democrats | M. Cody | 1,285 | 18.0 | ||
| Green | Nigel Birchenough | 243 | 3.4 | ||
| Majority | 3,055 | 42.7 | |||
| Registered electors | 14,231 | ||||
| Turnout | 50.3 | ||||
| Conservative hold | Swing | ||||
Claughton
| Party | Candidate | Votes | % | ±% | |
|---|---|---|---|---|---|
| Liberal Democrats | Stuart Kelly | 2,390 | 42.8 | ||
| Labour | S. Van Vliet | 1,736 | 31.1 | ||
| Conservative | D. Smith | 1,306 | 23.4 | ||
| Green | A. Cuthbertson | 153 | 2.7 | ||
| Majority | 654 | 11.7 | N/A | ||
| Registered electors | 10,914 | ||||
| Turnout | 51.2 | ||||
| Liberal Democrats hold | Swing | ||||
Eastham
| Party | Candidate | Votes | % | ±% | |
|---|---|---|---|---|---|
| Liberal Democrats | George Mitchell | 2,847 | 43.5 | ||
| Labour | K. Dawson | 1,977 | 30.2 | ||
| Conservative | A. Drury | 1,580 | 24.2 | ||
| Green | Perle Sheldricks | 136 | 2.1 | ||
| Majority | 870 | 13.3 | N/A | ||
| Registered electors | 11,994 | ||||
| Turnout | 54.5 | ||||
| Liberal Democrats hold | Swing | ||||
Egerton
| Party | Candidate | Votes | % | ±% | |
|---|---|---|---|---|---|
| Labour | Walter Smith | 2,452 | 51.7 | ||
| Conservative | A. Flynn | 1,066 | 22.5 | ||
| Liberal Democrats | Freda Anderson | 1,044 | 22.0 | ||
| Green | Tina Fox | 183 | 3.9 | ||
| Majority | 1,386 | 29.2 | |||
| Registered electors | 11,370 | ||||
| Turnout | 41.7 | ||||
| Labour hold | Swing | ||||
Heswall
| Party | Candidate | Votes | % | ±% | |
|---|---|---|---|---|---|
| Conservative | Peter Johnson | 4,883 | 72.0 | ||
| Liberal Democrats | W. Jones | 975 | 14.4 | ||
| Labour | H. Walsh | 693 | 10.2 | ||
| Green | J. Bruce | 230 | 3.4 | ||
| Majority | 3,908 | 57.6 | |||
| Registered electors | 13,374 | ||||
| Turnout | 50.7 | ||||
| Conservative hold | Swing | ||||
Hoylake
| Party | Candidate | Votes | % | ±% | |
|---|---|---|---|---|---|
| Conservative | John Hale [n 2][n 3] | 4,714 | 72.9 | ||
| Conservative | J. Stedmon [n 4] | 4,568 | – | – | |
| Liberal Democrats | S. Welshman | 772 | 11.9 | ||
| Liberal Democrats | J. Dennis | 761 | – | – | |
| Labour | S. Wynne | 654 | 10.1 | ||
| Labour | J. Rohan | 609 | – | – | |
| Green | L. Bufton | 325 | 5.0 | ||
| Green | Cecil Bowler | 317 | – | – | |
| Majority | 3,942 | 61.0 | |||
| Registered electors | 12,644 | ||||
| Turnout | 52.2 | ||||
| Conservative hold | Swing | ||||
| Conservative hold | Swing | – | |||
Leasowe
| Party | Candidate | Votes | % | ±% | |
|---|---|---|---|---|---|
| Labour | Michael Cashman | 1,779 | 39.6 | ||
| Independent Labour | Ken Fox | 1,326 | 29.5 | New | |
| Conservative | H. Tooke | 944 | 21.0 | ||
| Liberal Democrats | Moira Gallagher | 327 | 7.3 | ||
| Green | Allen Burton | 116 | 2.6 | ||
| Majority | 453 | 10.1 | |||
| Registered electors | 9,819 | ||||
| Turnout | 45.7 | ||||
| Labour gain from Independent Labour | Swing | ||||
Liscard
| Party | Candidate | Votes | % | ±% | |
|---|---|---|---|---|---|
| Labour | E. Williams | 2,753 | 45.2 | ||
| Conservative | M. Ebbs | 2,412 | 39.6 | ||
| Liberal Democrats | John Uriel | 660 | 10.8 | ||
| Green | W. Lorimer | 271 | 4.4 | ||
| Majority | 341 | 5.6 | |||
| Registered electors | 11,644 | ||||
| Turnout | 52.3 | ||||
| Labour gain from Conservative | Swing | ||||
Moreton
| Party | Candidate | Votes | % | ±% | |
|---|---|---|---|---|---|
| Conservative | Ann Dishman | 2,701 | 48.8 | ||
| Labour | Yvonne Nolan | 1,501 | 27.1 | ||
| Independent Labour | H. Euers | 755 | 13.7 | New | |
| Liberal Democrats | C. Robertson | 434 | 7.8 | ||
| Green | R. Georgeson | 140 | 2.5 | ||
| Majority | 1,200 | 21.7 | N/A | ||
| Registered electors | 9,381 | ||||
| Turnout | 59.0 | ||||
| Conservative gain from Labour | Swing | ||||
New Brighton
| Party | Candidate | Votes | % | ±% | |
|---|---|---|---|---|---|
| Conservative | A. Adams | 2,849 | 49.7 | ||
| Labour | Aileen Keyes | 1,869 | 32.6 | ||
| Liberal Democrats | John Codling | 679 | 11.8 | ||
| Green | Sally Davis | 341 | 5.9 | ||
| Majority | 980 | 17.1 | N/A | ||
| Registered electors | 11,688 | ||||
| Turnout | 49.1 | ||||
| Conservative hold | Swing | ||||
Oxton
| Party | Candidate | Votes | % | ±% | |
|---|---|---|---|---|---|
| Liberal Democrats | Patricia Willams | 2,792 | 47.4 | ||
| Conservative | R. Hughes | 1,883 | 32.0 | ||
| Labour | J. Mitchell | 973 | 16.5 | ||
| Green | K. Cuthbertson | 242 | 4.1 | ||
| Majority | 909 | 15.4 | |||
| Registered electors | 11,781 | ||||
| Turnout | 50.0 | ||||
| Liberal Democrats hold | Swing | ||||
Prenton
| Party | Candidate | Votes | % | ±% | |
|---|---|---|---|---|---|
| Conservative | Lesley Rennie | 2,709 | 39.2 | ||
| Liberal Democrats | John Thornton | 2,620 | 37.9 | ||
| Labour | W. Lowe | 1,431 | 20.7 | ||
| Green | David Pye | 148 | 2.1 | ||
| Majority | 89 | 1.3 | N/A | ||
| Registered electors | 12,253 | ||||
| Turnout | 56.4 | ||||
| Conservative gain from Liberal Democrats | Swing | ||||
Royden
| Party | Candidate | Votes | % | ±% | |
|---|---|---|---|---|---|
| Conservative | C. Kevan | 4,394 | 66.7 | ||
| Liberal Democrats | B. Crosbie | 913 | 13.9 | ||
| Labour | P. Jones | 849 | 12.9 | ||
| Green | Garnette Bowler | 432 | 6.6 | ||
| Majority | 3,481 | 52.8 | |||
| Registered electors | 12,829 | ||||
| Turnout | 51.3 | ||||
| Conservative hold | Swing | ||||
Seacombe
| Party | Candidate | Votes | % | ±% | |
|---|---|---|---|---|---|
| Labour | J. Scully | 3,229 | 62.4 | ||
| Conservative | L. May | 1,159 | 22.4 | ||
| Liberal Democrats | D. Kelly | 545 | 10.5 | ||
| Green | L. Georgeson | 238 | 4.6 | ||
| Majority | 2,070 | 40.0 | |||
| Registered electors | 11,792 | ||||
| Turnout | 43.8 | ||||
| Labour hold | Swing | ||||
Thurstaston
| Party | Candidate | Votes | % | ±% | |
|---|---|---|---|---|---|
| Conservative | Jeffrey Green | 4,220 | 66.5 | ||
| Labour | W. Gamet | 960 | 15.1 | ||
| Liberal Democrats | Charles Wall | 837 | 13.2 | ||
| Green | David Burton | 326 | 5.1 | ||
| Majority | 3,260 | 51.4 | |||
| Registered electors | 12,704 | ||||
| Turnout | 49.9 | ||||
| Conservative hold | Swing | ||||
Tranmere
| Party | Candidate | Votes | % | ±% | |
|---|---|---|---|---|---|
| Labour | Christine Meaden | 2,360 | 64.5 | ||
| Conservative | Mark Hughes | 678 | 18.5 | ||
| Liberal Democrats | Stephen Blaylock | 461 | 12.6 | ||
| Green | Angela Upton | 162 | 4.4 | ||
| Majority | 1,682 | 46.0 | |||
| Registered electors | 10,066 | ||||
| Turnout | 36.4 | ||||
| Labour hold | Swing | ||||
Upton
| Party | Candidate | Votes | % | ±% | |
|---|---|---|---|---|---|
| Labour | Peter Corcoran | 2,598 | 40.8 | ||
| Conservative | Geoffrey Caton | 2,532 | 39.7 | ||
| Liberal Democrats | Eric Copestake | 993 | 15.6 | ||
| Green | S. Boyle | 252 | 4.0 | ||
| Majority | 66 | 1.1 | |||
| Registered electors | 12,963 | ||||
| Turnout | 49.2 | ||||
| Labour hold | Swing | ||||
Wallasey
| Party | Candidate | Votes | % | ±% | |
|---|---|---|---|---|---|
| Conservative | C. Whatling | 4,080 | 60.5 | ||
| Labour | D. Pitchard | 1,271 | 18.8 | ||
| Liberal Democrats | Peter Reisdorf | 1,159 | 17.2 | ||
| Green | Barbara Burton | 238 | 3.5 | ||
| Majority | 2,809 | 41.7 | |||
| Registered electors | 12,271 | ||||
| Turnout | 55.0 | ||||
| Conservative hold | Swing | ||||
Notes
• italics denote the sitting councillor • bold denotes the winning candidate
References
- 1 2 3 "Local Election Summaries 1991". The Elections Centre. Retrieved 14 January 2019.
- 1 2 3 4 5 6 7 8 9 10 11 12 13 14 15 16 17 18 19 20 21 22 23 "Metropolitan Borough of Wirral Election Results 1973-2012 (Pg. 10 and 11)" (PDF). The Elections Centre. Retrieved 14 January 2019.
- ↑ "Council compositions". The Elections Centre. Retrieved 27 July 2018.
- ↑ "Councillor Harry Smith". Wirral Metropolitan Borough Council.
- ↑ "Councillor Phil Davies". Wirral Metropolitan Borough Council. Archived from the original on 12 June 2018. Retrieved 15 January 2019.
- ↑ "Councillor Steve Niblock". Wirral Metropolitan Borough Council.
- ↑ "Councillor Stuart Kelly". Wirral Metropolitan Borough Council. 10 August 2023.
- ↑ "Councillor Dave Mitchell". Wirral Metropolitan Borough Council.
- ↑ "Councillor Walter Smith". Wirral Metropolitan Borough Council. Archived from the original on 12 June 2018. Retrieved 15 January 2019.
- ↑ "Councillor Peter Johnson". Wirral Metropolitan Borough Council.
- ↑ "Councillor John Hale". Wirral Metropolitan Borough Council. Archived from the original on 5 July 2018. Retrieved 16 January 2019.
- ↑ "Councillor Yvonne Nolan". Wirral Metropolitan Borough Council. Retrieved 8 May 2019.
- ↑ "Councillor Pat Williams". Wirral Metropolitan Borough Council. Archived from the original on 12 June 2018. Retrieved 16 January 2019.
- ↑ "Councillor Lesley Rennie". Wirral Metropolitan Borough Council. 10 August 2023.
- ↑ "Councillor Jeff Green". Wirral Metropolitan Borough Council. 10 August 2023.
- ↑ "Councillor Chris Meaden". Wirral Metropolitan Borough Council.
- ↑ "Councillor Peter Reisdorf". Wirral Metropolitan Borough Council.
Mellows-Facer, Adam (10 May 2006). "Local election 2006". parliament.uk. Retrieved 29 December 2018.
"BBC NEWS VOTE 2003 WIRRAL". BBC News. 1 May 2003. Retrieved 29 December 2018.
This article is issued from Wikipedia. The text is licensed under Creative Commons - Attribution - Sharealike. Additional terms may apply for the media files.

