| |||||||||||||||||||||||||
11 of the 33 seats to City of Lincoln Council 17 seats needed for a majority | |||||||||||||||||||||||||
|---|---|---|---|---|---|---|---|---|---|---|---|---|---|---|---|---|---|---|---|---|---|---|---|---|---|
| |||||||||||||||||||||||||
 Map showing the results the 1991 Lincoln City Council elections by ward. Red shows Labour seats and blue shows Conservative seats. | |||||||||||||||||||||||||
| |||||||||||||||||||||||||
The 1991 City of Lincoln Council election took place on 2 May 1991. This was on the same day as other local elections. One third of the council was up for election: the seats of which were last contested in 1987. The Labour Party retained control of the council.
Overall results
| Party | Seats | Gains | Losses | Net gain/loss | Seats % | Votes % | Votes | +/− | |
|---|---|---|---|---|---|---|---|---|---|
| Labour | 10 | 3 | 0 | 90.9 | 59.7 | 16,710 | |||
| Conservative | 1 | 0 | 3 | 9.1 | 35.3 | 9,864 | |||
| Green | 0 | 0 | 0 | 0.0 | 4.4 | 1,218 | |||
| Independent Liberal | 0 | 0 | 0 | 0.0 | 0.7 | 186 | New | ||
| Total | 11 | 27,978 | |||||||
All comparisons in vote share are to the corresponding 1987 election.
Ward results
Abbey

Location of Abbey ward
| Party | Candidate | Votes | % | |
|---|---|---|---|---|
| Labour | Peter West[4] | 1,467 | 76.5% | |
| Conservative | Meads R. | 451 | 23.5% | |
| Turnout | 39.4% | |||
| Labour hold | ||||
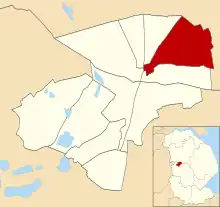
Birchwood

Location of Birchwood ward
| Party | Candidate | Votes | % | |
|---|---|---|---|---|
| Conservative | Edmund Strengiel[5] | 1,941 | 49.7% | |
| Labour | D. Martin | 1,705 | 43.7% | |
| Green | P. North | 259 | 6.6% | |
| Turnout | 41.9% | |||
| Conservative hold | ||||
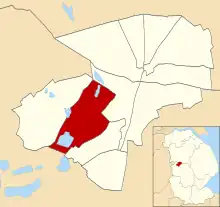
Boultham

Location of Boultham ward
| Party | Candidate | Votes | % | |
|---|---|---|---|---|
| Labour | T. Rook | 1,612 | 71.2% | |
| Conservative | P. Isaac | 493 | 21.8% | |
| Green | S. Brown | 160 | 7.1% | |
| Turnout | 44.6% | |||
| Labour hold | ||||
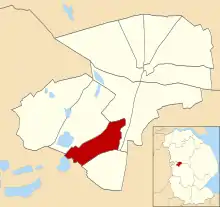
Bracebridge

Location of Bracebridge ward
| Party | Candidate | Votes | % | |
|---|---|---|---|---|
| Labour | R. Hall | 1,542 | 55.6% | |
| Conservative | E. Jenkins | 1,233 | 44.4% | |
| Turnout | 47.5% | |||
| Labour gain from Conservative | ||||
Carholme

Location of Carholme ward
| Party | Candidate | Votes | % | |
|---|---|---|---|---|
| Labour | L. Richardson | 1,414 | 54.5% | |
| Conservative | M. Mellows | 884 | 34.1% | |
| Green | I. McPherson | 297 | 11.4% | |
| Turnout | 50.7% | |||
| Labour gain from Conservative | ||||
Castle

Location of Castle ward
| Party | Candidate | Votes | % | |
|---|---|---|---|---|
| Labour | Anthony Morgan[6] | 1,563 | 64.6% | |
| Conservative | I. Adams | 643 | 26.6% | |
| Green | D. Kane | 213 | 8.8% | |
| Turnout | 44.7% | |||
| Labour hold | ||||
Longdales
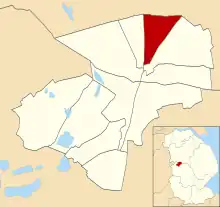
Location of Longdales ward
| Party | Candidate | Votes | % | |
|---|---|---|---|---|
| Labour | Neil Murray[7] | 1,614 | 63.7% | |
| Conservative | Sandra Gratrick[8] | 920 | 36.3% | |
| Turnout | 51.2% | |||
| Labour hold | ||||
Minster
Location of Minster ward
| Party | Candidate | Votes | % | |
|---|---|---|---|---|
| Labour | Jerome O'Brien[9] | 1,785 | 54.2% | |
| Conservative | David Gratrick[10] | 1,157 | 35.1% | |
| Independent Liberal | D. Webb | 186 | 5.6% | |
| Green | P. Watkins | 167 | 5.1% | |
| Turnout | 45.5% | |||
| Labour hold | ||||
Moorland
Location of Moorland ward
| Party | Candidate | Votes | % | |
|---|---|---|---|---|
| Labour | E. Noble | 1,342 | 51.9% | |
| Conservative | Hilton Spratt[11] | 1,245 | 48.1% | |
| Turnout | 52.2% | |||
| Labour gain from Conservative | ||||
Park

Location of Park ward
| Party | Candidate | Votes | % | |
|---|---|---|---|---|
| Labour | David Jackson[12] | 1,188 | 68.6% | |
| Conservative | F. Kay | 423 | 24.4% | |
| Green | K. Yates | 122 | 7.0% | |
| Turnout | 36.2% | |||
| Labour hold | ||||
Tritton
Location of Tritton ward
| Party | Candidate | Votes | % | |
|---|---|---|---|---|
| Labour | R. Hurst | 1,478 | 75.7% | |
| Conservative | P. Farrow | 474 | 24.3% | |
| Turnout | 47.1% | |||
| Labour hold | ||||
References
- ↑ "Council compositions by year". The Elections Centre.
- ↑ "Local Election Summaries 1991". The Elections Centre.
- 1 2 3 4 5 6 7 8 9 10 11 "City of Lincoln Council Election Results 1973-2012". Elections Centre. Retrieved 29 October 2019.
- ↑ "Councillors - Abbey ward". Archived from the original on 19 April 2003. Retrieved 4 November 2019.
- ↑ "Councillors - Birchwood ward". City of Lincoln Council. Archived from the original on 26 August 2003. Retrieved 4 November 2019.
- ↑ "Councillors - Castle ward". Archived from the original on 19 April 2003. Retrieved 4 November 2019.
- ↑ "Councillors - Carholme ward". Archived from the original on 26 August 2003. Retrieved 5 November 2019.
- ↑ "Councillors - Minster ward". Archived from the original on 7 October 2006. Retrieved 5 November 2019.
- ↑ "Councillors - Glebe ward". Archived from the original on 19 April 2003. Retrieved 4 November 2019.
- ↑ "Councillors - Minster ward". Archived from the original on 19 April 2003. Retrieved 4 November 2019.
- ↑ "Councillors - Bracebridge ward". Archived from the original on 19 April 2003. Retrieved 4 November 2019.
- ↑ "Councillors - Park ward". Archived from the original on 19 April 2003. Retrieved 5 November 2019.
| Lincolnshire County Council | |||||||||||||||||||||
|---|---|---|---|---|---|---|---|---|---|---|---|---|---|---|---|---|---|---|---|---|---|
| Boston Borough Council | |||||||||||||||||||||
| East Lindsey District Council | |||||||||||||||||||||
| City of Lincoln Council | |||||||||||||||||||||
| North East Lincolnshire Council | |||||||||||||||||||||
| North Kesteven District Council | |||||||||||||||||||||
| North Lincolnshire Council | |||||||||||||||||||||
| South Holland District Council | |||||||||||||||||||||
| South Kesteven District Council | |||||||||||||||||||||
| West Lindsey District Council | |||||||||||||||||||||
| |||||||||||||||||||||
| |||||||||||||||||||||
| Metropolitan boroughs |
|
|---|---|
| District councils (England) |
|
| District councils (Wales) |
|
This article is issued from Wikipedia. The text is licensed under Creative Commons - Attribution - Sharealike. Additional terms may apply for the media files.