| |||||||||||||||||||||||||||||||||
| Turnout | 75.32% (of registered voters) 54.52% (of eligible voters) | ||||||||||||||||||||||||||||||||
|---|---|---|---|---|---|---|---|---|---|---|---|---|---|---|---|---|---|---|---|---|---|---|---|---|---|---|---|---|---|---|---|---|---|
| |||||||||||||||||||||||||||||||||
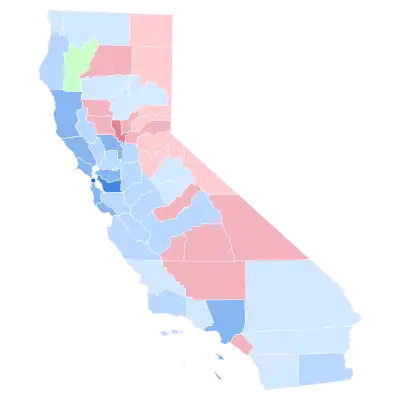
 County Results
| |||||||||||||||||||||||||||||||||
| |||||||||||||||||||||||||||||||||
| Elections in California |
|---|
 |

The 1992 United States presidential election in California took place on November 3, 1992, and was part of the 1992 United States presidential election. Voters chose 54 representatives, or electors to the Electoral College, who voted for president and vice president.
California voted for Democratic presidential candidate Bill Clinton. His victory marked the first time the Golden State had voted for a Democratic presidential nominee since Lyndon B. Johnson’s 1964 landslide, and only the second time since 1948. This would also be the first time since 1932 that a non-incumbent Democrat won California. Clinton's win in this state reflected the change in its status from a Republican-leaning swing state to a Democratic stronghold. California maintains the largest number of electoral votes in the Electoral College.
It was the first occasion that San Diego County had voted for a Democrat since Franklin D. Roosevelt in 1944.
As of the 2020 presidential election, this is the last time that any of the following counties were won by the Democratic nominee: Del Norte, Mariposa, Plumas, Siskiyou, Tehama, and Tuolumne.[2] Ross Perot gained a plurality in Trinity County, the only time a non-major party candidate has carried any county in the state since Progressive Party candidate Robert La Follette Sr. in 1924.
Results
| 1992 United States presidential election in California[3] | |||||
|---|---|---|---|---|---|
| Party | Candidate | Votes | Percentage | Electoral votes | |
| Democratic | William Jefferson Clinton | 5,121,325 | 46.01% | 54 | |
| Republican | George Herbert Walker Bush (Incumbent) | 3,630,574 | 32.61% | 0 | |
| Independent | Henry Ross Perot | 2,296,006 | 20.63% | 0 | |
| Libertarian | Andre Marrou | 48,139 | 0.43% | 0 | |
| Peace and Freedom | Ron Daniels | 18,597 | 0.17% | 0 | |
| Taxpayers’ | Howard Phillips | 12,711 | 0.11% | 0 | |
| America First | James "Bo" Gritz (write-in) | 3,077 | 0.03% | 0 | |
| Natural Law | Dr. John Hagelin (write-in) | 836 | 0.01% | 0 | |
| Democrats for Economic Recovery | Lyndon LaRouche (write-in) | 180 | >0.01% | 0 | |
| Other write-ins | 149 | >0.01% | 0 | ||
| Independent | Willie Carter (write-in) | 131 | >0.01% | 0 | |
| Socialist Workers Party | James Warren (write-in) | 115 | >0.01% | 0 | |
| Independent | Gene Smith (write-in) | 18 | >0.01% | 0 | |
| Independent | Isabell Masters (write-in) | 12 | >0.01% | 0 | |
| Invalid or blank votes | 242,844 | 2.13% | — | ||
| Totals | 11,374,565 | 100.0% | 54 | ||
| Voter turnout | 54.52% | — | |||
By county
| County | Clinton | Votes | Bush | Votes | Perot | Votes | Others | Votes |
|---|---|---|---|---|---|---|---|---|
| San Francisco | 72.40% | 233,263 | 17.80% | 57,352 | 9.01% | 29,018 | 0.80% | 2,574 |
| Alameda | 63.04% | 334,224 | 20.62% | 109,292 | 15.40% | 81,643 | 0.94% | 4,986 |
| Marin | 58.27% | 76,158 | 23.32% | 30,479 | 17.59% | 22,986 | 0.83% | 1,084 |
| Santa Cruz | 58.06% | 66,183 | 21.86% | 24,916 | 18.96% | 21,615 | 1.12% | 1,278 |
| San Mateo | 53.97% | 149,232 | 27.15% | 75,080 | 18.25% | 50,465 | 0.63% | 1,731 |
| Yolo | 53.33% | 33,297 | 28.15% | 17,574 | 17.73% | 11,073 | 0.79% | 492 |
| Sonoma | 52.78% | 104,334 | 24.09% | 47,619 | 22.19% | 43,859 | 0.95% | 1,879 |
| Los Angeles | 52.54% | 1,446,529 | 29.04% | 799,607 | 17.75% | 488,624 | 0.68% | 18,643 |
| Contra Costa | 50.93% | 194,960 | 29.51% | 112,965 | 18.94% | 72,518 | 0.62% | 2,380 |
| Mendocino | 50.21% | 18,344 | 21.78% | 7,958 | 26.69% | 9,753 | 1.32% | 483 |
| Santa Clara | 49.21% | 296,265 | 28.38% | 170,870 | 21.41% | 128,895 | 1.00% | 6,025 |
| Solano | 48.69% | 64,320 | 29.43% | 38,883 | 21.08% | 27,851 | 0.80% | 1,057 |
| Humboldt | 48.07% | 28,854 | 30.49% | 18,299 | 20.56% | 12,340 | 0.88% | 528 |
| Monterey | 47.01% | 54,861 | 31.25% | 36,461 | 20.97% | 24,472 | 0.77% | 895 |
| Lake | 45.44% | 10,548 | 28.77% | 6,678 | 24.97% | 5,797 | 0.82% | 190 |
| Napa | 45.30% | 24,215 | 29.30% | 15,662 | 24.60% | 13,150 | 0.80% | 428 |
| Imperial | 43.88% | 11,109 | 38.55% | 9,759 | 16.77% | 4,247 | 0.80% | 203 |
| Sacramento | 43.56% | 197,540 | 35.36% | 160,366 | 20.16% | 91,412 | 0.92% | 4,194 |
| Santa Barbara | 42.53% | 69,215 | 35.25% | 57,375 | 21.57% | 35,105 | 0.65% | 1,061 |
| Fresno | 42.17% | 92,418 | 40.67% | 89,137 | 16.56% | 36,299 | 0.60% | 1,307 |
| San Benito | 42.03% | 5,354 | 32.28% | 4,112 | 24.98% | 3,182 | 0.71% | 91 |
| San Joaquin | 41.28% | 63,655 | 37.84% | 58,355 | 20.24% | 31,205 | 0.65% | 995 |
| Stanislaus | 40.95% | 52,415 | 36.93% | 47,275 | 21.60% | 27,651 | 0.52% | 664 |
| Merced | 40.85% | 20,133 | 36.48% | 17,981 | 22.15% | 10,914 | 0.52% | 256 |
| Siskiyou | 39.91% | 8,254 | 32.21% | 6,660 | 26.92% | 5,567 | 0.96% | 198 |
| Del Norte | 38.91% | 3,639 | 32.96% | 3,083 | 27.53% | 2,575 | 0.60% | 56 |
| Kings | 38.91% | 9,982 | 41.61% | 10,673 | 19.10% | 4,899 | 0.38% | 97 |
| San Bernardino | 38.74% | 183,634 | 37.24% | 176,563 | 23.03% | 109,183 | 0.99% | 4,690 |
| Riverside | 38.64% | 166,241 | 37.06% | 159,457 | 23.76% | 102,233 | 0.54% | 2,344 |
| San Luis Obispo | 38.36% | 40,136 | 34.78% | 36,384 | 26.11% | 27,314 | 0.75% | 785 |
| Butte | 38.22% | 32,489 | 37.18% | 31,608 | 23.80% | 20,231 | 0.81% | 686 |
| Tuolumne | 38.12% | 9,216 | 35.26% | 8,525 | 26.03% | 6,294 | 0.59% | 143 |
| Plumas | 37.61% | 3,742 | 36.17% | 3,599 | 25.64% | 2,551 | 0.57% | 57 |
| San Diego | 37.24% | 367,397 | 35.69% | 352,125 | 26.28% | 259,249 | 0.80% | 7,875 |
| Ventura | 36.99% | 99,011 | 35.46% | 94,911 | 26.84% | 71,844 | 0.70% | 1,881 |
| Mariposa | 36.48% | 3,023 | 35.98% | 2,982 | 26.68% | 2,211 | 0.86% | 71 |
| Madera | 35.92% | 10,863 | 43.20% | 13,066 | 20.35% | 6,156 | 0.53% | 160 |
| Tehama | 35.79% | 7,508 | 35.36% | 7,419 | 28.05% | 5,884 | 0.80% | 168 |
| Calaveras | 35.25% | 5,989 | 35.35% | 6,006 | 28.53% | 4,848 | 0.87% | 148 |
| Tulare | 35.22% | 31,188 | 45.71% | 40,482 | 18.55% | 16,430 | 0.51% | 453 |
| Nevada | 34.92% | 15,433 | 39.24% | 17,343 | 25.05% | 11,072 | 0.80% | 353 |
| Sierra | 34.83% | 653 | 36.85% | 691 | 27.68% | 519 | 0.64% | 12 |
| Amador | 34.25% | 5,286 | 35.49% | 5,477 | 29.50% | 4,553 | 0.76% | 118 |
| Yuba | 34.24% | 5,785 | 43.40% | 7,333 | 21.53% | 3,637 | 0.83% | 140 |
| Mono | 34.19% | 1,489 | 36.05% | 1,570 | 28.66% | 1,248 | 1.10% | 48 |
| Alpine | 34.07% | 215 | 35.18% | 222 | 29.48% | 186 | 1.27% | 8 |
| Kern | 33.75% | 60,510 | 45.05% | 80,762 | 20.58% | 36,891 | 0.61% | 1,100 |
| Placer | 33.69% | 30,783 | 41.92% | 38,298 | 23.80% | 21,741 | 0.60% | 544 |
| Lassen | 32.70% | 3,388 | 37.02% | 3,836 | 28.99% | 3,004 | 1.29% | 134 |
| Trinity | 32.63% | 1,967 | 31.28% | 1,886 | 34.70% | 2,092 | 1.39% | 84 |
| El Dorado | 32.38% | 21,012 | 39.92% | 25,906 | 26.97% | 17,503 | 0.72% | 466 |
| Modoc | 32.19% | 1,489 | 38.98% | 1,803 | 27.44% | 1,269 | 1.38% | 64 |
| Colusa | 31.91% | 1,798 | 45.94% | 2,589 | 21.40% | 1,206 | 0.75% | 42 |
| Inyo | 31.84% | 2,695 | 43.58% | 3,689 | 23.62% | 1,999 | 0.96% | 81 |
| Shasta | 31.61% | 21,605 | 41.24% | 28,190 | 26.32% | 17,990 | 0.84% | 574 |
| Orange | 31.56% | 306,930 | 43.87% | 426,613 | 23.90% | 232,394 | 0.68% | 6,612 |
| Sutter | 30.48% | 7,883 | 50.10% | 12,956 | 18.87% | 4,881 | 0.54% | 140 |
| Glenn | 30.24% | 2,666 | 43.24% | 3,812 | 25.84% | 2,278 | 0.68% | 60 |
Counties that flipped from Republican to Democratic
Counties that flipped from Republican to Independent
References
- ↑ "Historical Voter Registration and Participation in Statewide General Elections 1910-2018" (PDF). California Secretary of State. Retrieved May 5, 2022.
- ↑ Sullivan, Robert David; ‘How the Red and Blue Map Evolved Over the Past Century’; America Magazine in The National Catholic Review; June 29, 2016
- ↑ "President" (PDF). California Secretary of State. December 12, 1992. Archived from the original (PDF) on July 30, 2008. Retrieved August 10, 2008.

.jpg.webp)

