| |||||||||||||||||||||||||||||||||
| |||||||||||||||||||||||||||||||||


| |||||||||||||||||||||||||||||||||
| |||||||||||||||||||||||||||||||||
| Elections in Maine |
|---|
 |
The 1992 United States presidential election in Maine took place on November 3, 1992, as part of the 1992 United States presidential election. Voters chose four representatives, or electors to the Electoral College, who voted for president and vice president.
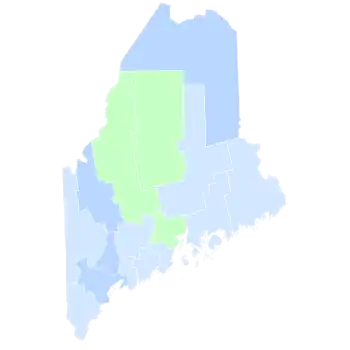
Maine was won by Governor Bill Clinton (D-Arkansas) with 38.77% of the popular vote over businessman Ross Perot (I-Texas) with 30.44%. Incumbent President George H. W. Bush (R-Texas) finished in third, close behind Perot, with 30.39% of the popular vote.[1] Despite the Bush family having ties to Maine, with Bush owning a house in Kennebunkport, Maine, Perot beat Bush for second place in the state by a slim margin of 316 votes, making Maine one of two states where Perot finished better than third place, the other being Utah,[2] though Maine was the only state of the two where Perot won any counties. Clinton ultimately won the national vote, defeating both incumbent President Bush and Perot.[3] Perot's 30.44% would prove Maine as his strongest state in the 1992 election.[4] Ross Perot came within 4.55% of winning an electoral vote in Maine’s second congressional district, the closest he came to winning an electoral vote. In Maine's first congressional district, Bush finished in second place, with the 8.11% margin being the closest Bush would come in 1992 to winning an electoral vote in New England after New Hampshire and Connecticut.
Clinton was the first Democrat to carry the state of Maine since 1968 when Hubert Humphrey, running with Maine Senator Edmund Muskie as vice-presidential candidate, did so.[5] Maine would not vote Republican again, though Donald Trump would win a single electoral vote from Maine's 2nd district in 2016 and 2020.
As of 2020, this is the last time that a sitting president finished third in a state or (along with Utah) that a non-major party candidate would come in second or better.
Results
| 1992 United States presidential election in Maine[1] | |||||
|---|---|---|---|---|---|
| Party | Candidate | Votes | Percentage | Electoral votes | |
| Democratic | Bill Clinton | 263,420 | 38.77% | 4 | |
| Independent | Ross Perot | 206,820 | 30.44% | 0 | |
| Republican | George H. W. Bush (incumbent) | 206,504 | 30.39% | 0 | |
| Libertarian | Andre Marrou | 1,681 | 0.25% | 0 | |
| New Alliance | Lenora Fulani | 519 | 0.08% | 0 | |
| U.S. Taxpayers' | Howard Phillips | 464 | 0.07% | 0 | |
| Write-ins | 91 | 0.01% | 0 | ||
| Totals | 679,499 | 100.0% | 4 | ||
| Voter Turnout (Voting age/Registered) | 72%/70% | ||||
Results by county
| County | William Jefferson Clinton[6] Democratic |
George Herbert Walker Bush[6] Republican |
Henry Ross Perot[6] Independent |
Andre Verne Marrou[6] Libertarian |
Various candidates[6] Other parties |
Margin[lower-alpha 1] | Total votes cast | ||||||
|---|---|---|---|---|---|---|---|---|---|---|---|---|---|
| # | % | # | % | # | % | # | % | # | % | # | % | ||
| Androscoggin | 22,247 | 40.34% | 14,174 | 25.70% | 18,518 | 33.58% | 114 | 0.21% | 91 | 0.17% | 3,729 | 6.76% | 55,144 |
| Aroostook | 15,682 | 40.64% | 12,409 | 32.16% | 10,376 | 26.89% | 46 | 0.12% | 72 | 0.19% | 3,273[lower-alpha 2] | 8.48% | 38,585 |
| Cumberland | 60,781 | 42.95% | 45,752 | 32.33% | 34,443 | 24.34% | 373 | 0.26% | 173 | 0.12% | 15,029[lower-alpha 2] | 10.62% | 141,522 |
| Franklin | 6,739 | 40.79% | 4,608 | 27.89% | 5,115 | 30.96% | 37 | 0.22% | 24 | 0.15% | 1,624 | 9.83% | 16,523 |
| Hancock | 10,126 | 35.15% | 8,657 | 30.05% | 9,865 | 34.25% | 75 | 0.26% | 82 | 0.28% | 261 | 0.91% | 28,805 |
| Kennebec | 25,125 | 39.31% | 17,135 | 26.81% | 21,436 | 33.54% | 126 | 0.20% | 99 | 0.15% | 3,689 | 5.77% | 63,921 |
| Knox | 7,631 | 37.52% | 6,310 | 31.03% | 6,303 | 30.99% | 62 | 0.30% | 32 | 0.16% | 1,321[lower-alpha 2] | 6.50% | 20,338 |
| Lincoln | 6,714 | 35.27% | 6,405 | 33.65% | 5,808 | 30.51% | 78 | 0.49% | 31 | 0.19% | 309[lower-alpha 2] | 1.62% | 19,036 |
| Oxford | 11,202 | 38.16% | 8,194 | 27.91% | 9,815 | 33.43% | 89 | 0.30% | 56 | 0.19% | 1,387 | 4.72% | 29,356 |
| Penobscot | 29,485 | 36.65% | 24,218 | 30.11% | 26,437 | 32.86% | 175 | 0.22% | 129 | 0.16% | 3,048 | 3.79% | 80,444 |
| Piscataquis | 3,323 | 33.13% | 2,970 | 29.61% | 3,688 | 36.77% | 38 | 0.38% | 12 | 0.12% | -365 | -3.64% | 10,031 |
| Sagadahoc | 6,828 | 36.88% | 5,917 | 31.96% | 5,705 | 30.82% | 41 | 0.22% | 22 | 0.12% | 911[lower-alpha 2] | 4.92% | 18,513 |
| Somerset | 9,274 | 35.10% | 6,780 | 25.66% | 10,293 | 38.95% | 45 | 0.17% | 32 | 0.12% | -1,019 | -3.86% | 26,424 |
| Waldo | 6,472 | 34.93% | 5,241 | 28.29% | 6,702 | 36.17% | 77 | 0.42% | 37 | 0.20% | -230 | -1.24% | 18,529 |
| Washington | 6,284 | 35.37% | 5,493 | 30.92% | 5,894 | 33.18% | 60 | 0.34% | 34 | 0.19% | 390 | 2.20% | 17,765 |
| York | 35,507 | 37.55% | 32,241 | 34.09% | 26,422 | 27.94% | 245 | 0.26% | 148 | 0.16% | 3,266[lower-alpha 2] | 3.45% | 94,563 |
| Totals | 263,420 | 38.77% | 206,504 | 30.39% | 206,820 | 30.44% | 1,681 | 0.25% | 1,074 | 0.16% | 56,600 | 8.33% | 679,499 |
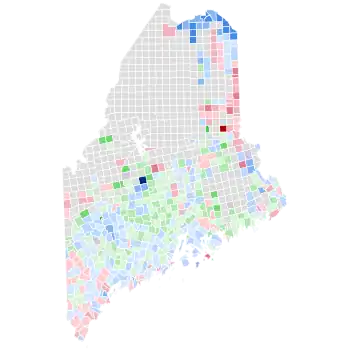
Counties that flipped from Republican to Democratic
Counties that flipped from Republican to Independent
See also
Notes
References
- 1 2 "1992 Presidential General Election Results – Maine". U.S. Election Atlas. Retrieved June 8, 2012.
- ↑ "Final Vote Returns Put Perot 2d in Maine, Ahead of Bush". The New York Times. November 24, 1992. Retrieved June 8, 2012.
- ↑ "1992 Presidential General Election Results". U.S. Election Atlas. Retrieved June 8, 2012.
- ↑ "1992 Presidential Election Statistics". Dave Leip’s Atlas of U.S. Presidential Elections. Retrieved March 5, 2018.
- ↑ Menendez, Albert J.; The Geography of Presidential Elections in the United States, 1868-2004, pp. 217-218 ISBN 0786422173
- 1 2 3 4 5 Our Campaigns; ME US Presidential Race, November 03, 1992


.jpg.webp)
