| |||||||||||||||||||||||||
All 60 seats to Barnet London Borough Council 31 seats needed for a majority | |||||||||||||||||||||||||
|---|---|---|---|---|---|---|---|---|---|---|---|---|---|---|---|---|---|---|---|---|---|---|---|---|---|
| Turnout | 50.0% | ||||||||||||||||||||||||
| |||||||||||||||||||||||||
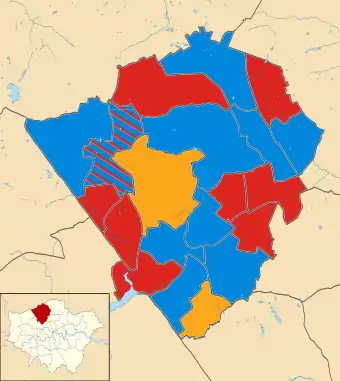 Map of the results of the 1994 Barnet London Borough council election. Conservatives in blue, Labour in red and Liberal Democrats in yellow.. | |||||||||||||||||||||||||
| |||||||||||||||||||||||||
The 1994 Barnet Council election took place on 5 May 1994 to elect members of Barnet London Borough Council in London, England. The whole council was up for election and the council went in no overall control.
Following the elections, a Labour-Liberal Democrat coalition was formed, replacing the previous Conservative majority.[1]
Background
Election result
Overall turnout in the election was 45.4%.
| Party | Seats | Gains | Losses | Net gain/loss | Seats % | Votes % | Votes | +/− | |
|---|---|---|---|---|---|---|---|---|---|
| Conservative | 29 | 36.7 | |||||||
| Labour | 25 | 40.1 | |||||||
| Liberal Democrats | 6 | 19.4 | |||||||
Ward results
Arkley
| Party | Candidate | Votes | % | ±% | |
|---|---|---|---|---|---|
| Labour | Anita Campbell* | 2,852 | 49.9 | ||
| Labour | Pamela Coleman* | 2,701 | 47.2 | ||
| Labour | Linda McFadyen | 2,574 | 45.0 | ||
| Conservative | Jonathan Kay | 1,854 | 32.4 | ||
| Conservative | Jeremy Cameron | 1,838 | 32.1 | ||
| Conservative | Arik Yacobi | 1,744 | 30.5 | ||
| Liberal Democrats | Mary Barnett | 975 | 17.0 | ||
| Liberal Democrats | Victor Godman | 869 | 15.2 | ||
| Liberal Democrats | Michael Cleal | 867 | 15.2 | ||
| Turnout | |||||
| Labour hold | Swing | ||||
| Labour hold | Swing | ||||
| Labour hold | Swing | ||||
Brunswick Park
| Party | Candidate | Votes | % | ±% | |
|---|---|---|---|---|---|
| Conservative | Donald Goodman* | 1,985 | 44.9 | -9.0 | |
| Conservative | Irene Palmer* | 1,834 | 41.5 | -9.6 | |
| Conservative | John Rawles* | 1,817 | 41.1 | -9.7 | |
| Labour | Jeffrey Cohen | 1,576 | 35.7 | +3.7 | |
| Labour | Bridget Griffin | 1,505 | 34.1 | +4.1 | |
| Labour | Ian Wallace | 1,472 | 33.3 | +3.6 | |
| Liberal Democrats | Peter Finlayson | 785 | 17.8 | +7.5 | |
| Liberal Democrats | Alwena Lillywhite | 723 | 16.4 | +6.0 | |
| Liberal Democrats | Yvonne Wicksteed | 688 | 15.6 | +5.8 | |
| Turnout | |||||
| Conservative hold | Swing | ||||
| Conservative hold | Swing | ||||
| Conservative hold | Swing | ||||
Burnt Oak
| Party | Candidate | Votes | % | ±% | |
|---|---|---|---|---|---|
| Labour | Rosemary Carney | 2,754 | 68.2 | +15.1 | |
| Labour | Alan Williams* | 2,722 | 67.4 | +8.6 | |
| Labour | Allan Turner* | 2,703 | 67.0 | +16.6 | |
| Conservative | Keith Dyall | 525 | 13.0 | -24.1 | |
| Conservative | Patricia Sparrow | 504 | 12.5 | -14.1 | |
| Conservative | Alan Maund | 481 | 11.9 | -13.5 | |
| Liberal Democrats | Barbara Farbey | 340 | 8.4 | +1.2 | |
| Liberal Democrats | Cyril Harris | 324 | 8.0 | N/A | |
| Liberal Democrats | Diana Pattison | 301 | 7.5 | N/A | |
| Green | Anne Doyle | 225 | 5.6 | -4.3 | |
| Turnout | |||||
| Labour hold | Swing | ||||
| Labour hold | Swing | ||||
| Labour hold | Swing | ||||
Childs Hill
| Party | Candidate | Votes | % | ±% | |
|---|---|---|---|---|---|
| Liberal Democrats | Jack Cohen* | 1,986 | 51.2 | +14.3 | |
| Liberal Democrats | Susette Palmer | 1,887 | 48.7 | +7.1 | |
| Liberal Democrats | Jonathan Davies | 1,765 | 45.5 | +9.9 | |
| Conservative | Abraham Dunner | 1,172 | 30.2 | -1.8 | |
| Conservative | Dineshwar Singh | 986 | 25.4 | -6.2 | |
| Conservative | Robert Halfon | 984 | 25.4 | -5.8 | |
| Labour | Anthony Hulstrom | 760 | 19.6 | -3.9 | |
| Labour | Ghada Karmi | 732 | 18.9 | -2.9 | |
| Labour | Bryan Reith | 710 | 18.3 | -2.3 | |
| Turnout | |||||
| Liberal Democrats hold | Swing | ||||
| Liberal Democrats hold | Swing | ||||
| Liberal Democrats hold | Swing | ||||
Colindale
| Party | Candidate | Votes | % | ±% | |
|---|---|---|---|---|---|
| Labour | Ellis Hillman* | 2,588 | 63.2 | +9.1 | |
| Labour | David Williams* | 2,553 | 62.3 | +10.8 | |
| Labour | Gillian Sargeant | 2,450 | 59.8 | +7.4 | |
| Conservative | Alan Scott | 747 | 18.2 | -6.3 | |
| Conservative | Philip Williams | 690 | 16.8 | N/A | |
| Conservative | Robert Linton | 688 | 16.8 | -7.9 | |
| Liberal Democrats | Mary Dodd | 430 | 10.5 | +2.5 | |
| Liberal Democrats | Arthur Roycroft | 389 | 9.5 | +2.1 | |
| Liberal Democrats | David Keech | 368 | 9.0 | +2.6 | |
| Green | Norman Crisp | 273 | 6.7 | -3.3 | |
| Turnout | |||||
| Labour hold | Swing | ||||
| Labour hold | Swing | ||||
| Labour hold | Swing | ||||
East Barnet
| Party | Candidate | Votes | % | ±% | |
|---|---|---|---|---|---|
| Labour | Elizabeth Jarvis | 2,331 | 43.4 | +5.1 | |
| Labour | Usha Chopra | 2,222 | 41.4 | +3.4 | |
| Labour | Richard Soer | 2,175 | 40.5 | +3.7 | |
| Conservative | Olwen Evans* | 1,992 | 37.1 | -8.3 | |
| Conservative | Jihad Anani* | 1,779 | 33.1 | -7.6 | |
| Conservative | Frixos Tombolis | 1,740 | 32.4 | -11.5 | |
| Liberal Democrats | Margaret Neil | 1,120 | 20.9 | +9.5 | |
| Liberal Democrats | Peter Watkins | 1,010 | 18.8 | +8.8 | |
| Liberal Democrats | Charles Wicksteed | 922 | 17.2 | +7.6 | |
| Turnout | |||||
| Labour gain from Conservative | Swing | ||||
| Labour gain from Conservative | Swing | ||||
| Labour gain from Conservative | Swing | ||||
East Finchley
| Party | Candidate | Votes | % | ±% | |
|---|---|---|---|---|---|
| Labour | Joan Ryan* | 3,416 | 61.0 | +2.6 | |
| Labour | Helen Gordon | 3,340 | 59.6 | -3.6 | |
| Labour | Rudi Vis* | 3,203 | 57.2 | +1.4 | |
| Conservative | Daniel Finkelstein | 1,187 | 21.2 | -12.7 | |
| Conservative | Barry Antoniou | 1,138 | 20.3 | -12.0 | |
| Conservative | Marc Landsman | 1,115 | 19.9 | -10.8 | |
| Green | Noel Lynch | 624 | 11.1 | N/A | |
| Liberal Democrats | Elinor Edwards | 595 | 10.6 | N/A | |
| Liberal Democrats | Diana Darrer | 582 | 10.4 | N/A | |
| Liberal Democrats | Thomas Darrer | 534 | 9.5 | N/A | |
| Turnout | |||||
| Labour hold | Swing | ||||
| Labour hold | Swing | ||||
| Labour hold | Swing | ||||
Edgware
| Party | Candidate | Votes | % | ±% | |
|---|---|---|---|---|---|
| Conservative | Julian Czarny* | 2,098 | 47.8 | -11.1 | |
| Conservative | Malcolm Lester* | 1,986 | 45.3 | -12.4 | |
| Conservative | Joan Scannell | 1,934 | 44.1 | -12.4 | |
| Labour | Alan Sloam | 1,430 | 32.6 | +6.6 | |
| Labour | Keith Hurcombe | 1,387 | 31.6 | +7.2 | |
| Labour | Zena Sloam | 1,336 | 30.5 | +5.9 | |
| Liberal Democrats | Susanne Gregory | 754 | 17.2 | +8.5 | |
| Liberal Democrats | June Burton | 741 | 16.9 | +10.0 | |
| Liberal Democrats | Kathleen Lamprell | 681 | 15.5 | +8.7 | |
| Turnout | |||||
| Conservative hold | Swing | ||||
| Conservative hold | Swing | ||||
| Conservative hold | Swing | ||||
Finchley
| Party | Candidate | Votes | % | ±% | |
|---|---|---|---|---|---|
| Conservative | Eva Greenspan* | 2,285 | 50.1 | -7.2 | |
| Conservative | Leslie Sussman* | 2,176 | 47.7 | -9.6 | |
| Conservative | Barbara Langstone* | 2,149 | 47.1 | -9.9 | |
| Labour | Denis Calnan | 1,384 | 30.3 | +1.6 | |
| Labour | Josephine Cuttell | 1,369 | 30.0 | +1.7 | |
| Labour | Mary McGuirk | 1,337 | 29.3 | -0.5 | |
| Liberal Democrats | Malcolm Blount | 721 | 15.8 | +9.8 | |
| Liberal Democrats | Jasbir Singh | 664 | 14.5 | +8.8 | |
| Green | Gustav Clarkson | 316 | 6.9 | -2.2 | |
| Green | Janet Strangeways | 217 | 4.8 | N/A | |
| Turnout | |||||
| Conservative hold | Swing | ||||
| Conservative hold | Swing | ||||
| Conservative hold | Swing | ||||
Friern Barnet
| Party | Candidate | Votes | % | ±% | |
|---|---|---|---|---|---|
| Conservative | Thomas Carter | 2,242 | 44.9 | -4.6 | |
| Conservative | Brian Salinger* | 2,198 | 44.0 | -5.5 | |
| Conservative | John Tiplady* | 2,179 | 43.6 | -6.2 | |
| Labour | Roger Chapman | 1,835 | 36.7 | +1.9 | |
| Labour | Simon Montague | 1,741 | 34.9 | +0.3 | |
| Labour | Michael Harris | 1,617 | 32.4 | -2.1 | |
| Liberal Democrats | Matthew Harris | 827 | 16.6 | +6.7 | |
| Liberal Democrats | Jonathan Griffiths | 774 | 15.5 | +6.0 | |
| Liberal Democrats | Steven Deller | 758 | 15.2 | +5.9 | |
| Turnout | |||||
| Conservative hold | Swing | ||||
| Conservative hold | Swing | ||||
| Conservative hold | Swing | ||||
Garden Suburb
| Party | Candidate | Votes | % | ±% | |
|---|---|---|---|---|---|
| Conservative | Frank Davis* | 1,748 | 42.6 | -17.5 | |
| Conservative | Roy Shutz* | 1,724 | 42.0 | -17.6 | |
| Conservative | Mohammed Khamisa* | 1,665 | 40.5 | -18.4 | |
| Liberal Democrats | Majorie Harris | 1,645 | 40.1 | +20.4 | |
| Liberal Democrats | Millicent Watkins | 1,552 | 37.8 | +18.6 | |
| Liberal Democrats | David Ive | 1,520 | 37.0 | +18.1 | |
| Labour | Naomi Angell | 668 | 16.3 | +4.7 | |
| Labour | Jula Westman | 648 | 15.8 | +4.2 | |
| Labour | Carol Kohll | 634 | 15.4 | +4.6 | |
| Turnout | |||||
| Conservative hold | Swing | ||||
| Conservative hold | Swing | ||||
| Conservative hold | Swing | ||||
Golders Green
| Party | Candidate | Votes | % | ±% | |
|---|---|---|---|---|---|
| Conservative | Melvin Cohen* | 1,758 | 43.3 | +2.8 | |
| Conservative | John Hedge* | 1,495 | 36.8 | +1.6 | |
| Conservative | Michele Moulin | 1,415 | 34.9 | -3.2 | |
| Labour | Michael Doyle | 1,218 | 30.0 | +2.2 | |
| Labour | Montague Miller | 1,137 | 28.0 | +0.5 | |
| Liberal Democrats | Barrie Manson | 1,106 | 27.2 | +0.3 | |
| Labour | Dorothy Macedo | 1,083 | 26.7 | -0.8 | |
| Liberal Democrats | Michael Green | 1,009 | 24.9 | -0.5 | |
| Liberal Democrats | Rita Druiff | 959 | 23.6 | -1.7 | |
| Green | Miranda Dunn | 125 | 3.1 | -3.4 | |
| Green | Karen Lansdowne | 97 | 2.4 | N/A | |
| Turnout | |||||
| Conservative hold | Swing | ||||
| Conservative hold | Swing | ||||
| Conservative hold | Swing | ||||
Hadley
| Party | Candidate | Votes | % | ±% | |
|---|---|---|---|---|---|
| Conservative | Mark Hayball | 2,377 | 37.8 | -11.1 | |
| Conservative | Hazel Mammatt* | 2,339 | 37.2 | -5.2 | |
| Conservative | Kantilal Patel | 2,037 | 32.4 | -12.5 | |
| Labour | Michael Campbell | 1,961 | 31.2 | +6.1 | |
| Labour | Jean Feldman | 1,915 | 30.4 | +8.2 | |
| Labour | David Clarke | 1,885 | 30.0 | +4.7 | |
| Liberal Democrats | Sean Hooker | 1,523 | 24.2 | +11.5 | |
| Liberal Democrats | Trevor Orr | 1,479 | 23.5 | +11.8 | |
| Liberal Democrats | Brigid Povah | 1,263 | 20.1 | +12.2 | |
| Green | Timothy Riley | 612 | 9.7 | -1.6 | |
| Independent | Christopher Johnson | 406 | 6.5 | N/A | |
| Turnout | |||||
| Conservative hold | Swing | ||||
| Conservative hold | Swing | ||||
| Conservative hold | Swing | ||||
Hale
| Party | Candidate | Votes | % | ±% | |
|---|---|---|---|---|---|
| Conservative | Leslie Pym* | 1,914 | 41.3 | -9.3 | |
| Conservative | Sheila Scott* | 1,859 | 40.2 | -8.9 | |
| Labour | Andrew Dickie | 1,820 | 39.3 | +9.1 | |
| Conservative | Graham Old | 1,726 | 37.3 | -11.0 | |
| Labour | Janet Heathfield | 1,701 | 36.7 | +5.2 | |
| Labour | William Parnaby | 1,653 | 35.7 | +6.3 | |
| Liberal Democrats | James Creighton | 788 | 17.0 | +6.9 | |
| Liberal Democrats | Guy Patton | 730 | 15.8 | +7.7 | |
| Liberal Democrats | Geoffrey Jacobs | 723 | 15.6 | +6.7 | |
| Turnout | |||||
| Conservative hold | Swing | ||||
| Conservative hold | Swing | ||||
| Labour gain from Conservative | Swing | ||||
Hendon
| Party | Candidate | Votes | % | ±% | |
|---|---|---|---|---|---|
| Conservative | Anthony Finn* | 2,036 | 45.8 | -9.5 | |
| Conservative | Frederick Poole* | 1,823 | 41.0 | -11.3 | |
| Conservative | Edward Bunn* | 1,791 | 40.3 | -13.0 | |
| Labour | Colin Francombe | 1,464 | 32.9 | +2.8 | |
| Labour | David Simons | 1,302 | 29.3 | -0.8 | |
| Labour | Alan Killingback | 1,260 | 28.3 | -0.1 | |
| Liberal Democrats | Fiona Palmer | 852 | 19.2 | +9.5 | |
| Liberal Democrats | Harold Defries | 825 | 18.6 | +9.6 | |
| Liberal Democrats | Martin Rodwell | 700 | 15.7 | +7.4 | |
| Green | Graham White | 325 | 7.3 | N/A | |
| Turnout | |||||
| Conservative hold | Swing | ||||
| Conservative hold | Swing | ||||
| Conservative hold | Swing | ||||
Mill Hill
| Party | Candidate | Votes | % | ±% | |
|---|---|---|---|---|---|
| Liberal Democrats | Sheila Gottsche | 1,836 | 38.7 | +27.3 | |
| Liberal Democrats | Jeremy Davies | 1,830 | 38.6 | +28.8 | |
| Liberal Democrats | Wayne Casey | 1,817 | 38.3 | +28.9 | |
| Conservative | John Hart* | 1,795 | 37.8 | -15.5 | |
| Conservative | Jane Ellison* | 1,781 | 37.5 | -17.8 | |
| Conservative | Peter Holland | 1,701 | 35.8 | -18.7 | |
| Labour | Jean Smith | 939 | 19.8 | -7.0 | |
| Labour | George Janeway | 923 | 19.5 | -5.0 | |
| Labour | Michael Epstein | 910 | 19.2 | -4.1 | |
| Turnout | |||||
| Liberal Democrats gain from Conservative | Swing | ||||
| Liberal Democrats gain from Conservative | Swing | ||||
| Liberal Democrats gain from Conservative | Swing | ||||
St Paul’s
| Party | Candidate | Votes | % | ±% | |
|---|---|---|---|---|---|
| Labour | Kitty Lyons | 2,553 | 45.1 | +5.6 | |
| Labour | Katherine McGuirk | 2,476 | 43.7 | +2.7 | |
| Labour | James Tierney | 2,428 | 42.9 | +5.1 | |
| Conservative | Helena Hart* | 2,148 | 37.9 | -6.5 | |
| Conservative | Mike Freer* | 2,143 | 37.9 | -6.3 | |
| Conservative | Mary Phillips* | 2,126 | 37.6 | -3.9 | |
| Liberal Democrats | Joan Beales | 514 | 9.1 | N/A | |
| Liberal Democrats | John Beales | 503 | 8.9 | N/A | |
| Liberal Democrats | David Loxton | 473 | 8.4 | N/A | |
| Green | Maureen Colmans | 322 | 5.7 | -8.7 | |
| Green | Ashley Gunstock | 314 | 5.5 | N/A | |
| Green | Dennis Vigay | 222 | 3.9 | N/A | |
| Turnout | |||||
| Labour gain from Conservative | Swing | ||||
| Labour gain from Conservative | Swing | ||||
| Labour gain from Conservative | Swing | ||||
Totteridge
| Party | Candidate | Votes | % | ±% | |
|---|---|---|---|---|---|
| Conservative | Victor Lyon* | 2,259 | 46.9 | -7.7 | |
| Conservative | Victor Usher* | 2,218 | 46.0 | -8.6 | |
| Conservative | Kevin Edson | 2,180 | 45.3 | -9.3 | |
| Labour | Timothy Roberts | 1,492 | 31.0 | +3.6 | |
| Labour | David Saxon | 1,441 | 29.9 | +4.3 | |
| Labour | Victoria Spawls | 1,439 | 29.9 | +5.1 | |
| Liberal Democrats | Jennifer Keech | 863 | 17.9 | +8.6 | |
| Liberal Democrats | Bernadette Cleal | 853 | 17.7 | +8.3 | |
| Liberal Democrats | Nicholas Sullivan | 853 | 17.7 | +8.5 | |
| Natural Law | Diane Derksen | 120 | 2.5 | N/A | |
| Turnout | |||||
| Conservative hold | Swing | ||||
| Conservative hold | Swing | ||||
| Conservative hold | Swing | ||||
West Hendon
| Party | Candidate | Votes | % | ±% | |
|---|---|---|---|---|---|
| Labour | Gina Marks* | 2,008 | 50.9 | +4.9 | |
| Labour | Agnes Slocombe* | 1,968 | 49.9 | +6.7 | |
| Labour | Nicholas Kissen | 1,941 | 49.2 | +3.8 | |
| Conservative | David Berens | 1,070 | 27.1 | -11.0 | |
| Conservative | David Twomey | 1,004 | 25.5 | -12.5 | |
| Conservative | Susan Twomey | 957 | 24.3 | -12.3 | |
| Liberal Democrats | Erika Coward | 500 | 12.7 | +4.2 | |
| Liberal Democrats | Richard Coward | 500 | 12.7 | +4.4 | |
| Liberal Democrats | Shirley Rodwell | 455 | 11.5 | +4.6 | |
| Green | Fiona Clode | 268 | 6.8 | N/A | |
| Turnout | |||||
| Labour hold | Swing | ||||
| Labour hold | Swing | ||||
| Labour hold | Swing | ||||
Woodhouse
| Party | Candidate | Votes | % | ±% | |
|---|---|---|---|---|---|
| Labour | Stanley Cross* | 3,084 | 48.9 | +1.3 | |
| Labour | Melanie Packer | 2,928 | 46.5 | -0.9 | |
| Labour | Joanna Salsbury | 2,915 | 46.3 | -0.9 | |
| Conservative | Brian Coleman | 2,093 | 33.2 | -12.8 | |
| Conservative | Mary Russell | 2,036 | 32.3 | -13.5 | |
| Conservative | Peter Yallouros | 1,986 | 31.5 | -12.9 | |
| Liberal Democrats | Rosalind Abrahams | 666 | 10.6 | N/A | |
| Liberal Democrats | Geoffrey Lee | 614 | 9.7 | N/A | |
| Liberal Democrats | Joy Manson | 585 | 9.3 | N/A | |
| Turnout | |||||
| Labour hold | Swing | ||||
| Labour hold | Swing | ||||
| Labour hold | Swing | ||||
By-elections between 1994 and 1998
Colindale
| Party | Candidate | Votes | % | ±% | |
|---|---|---|---|---|---|
| Labour | Thomas A. McKendry | 1,962 | 70.6 | ||
| Conservative | Alan R. Maund | 425 | 15.3 | ||
| Liberal Democrats | Roger L. Axworthy | 257 | 9.2 | ||
| Green | Norman D. Crisp | 71 | 2.6 | ||
| UKIP | Bernard P. Wright | 65 | 2.3 | ||
| Majority | 1,537 | 55.3 | |||
| Turnout | 2,780 | ||||
| Labour hold | Swing | ||||
The by-election was called following the death of Cllr. Ellis S. Hillman.
Colindale
| Party | Candidate | Votes | % | ±% | |
|---|---|---|---|---|---|
| Labour | Danish Chopra | 1,339 | 71.0 | +0.4 | |
| Conservative | Alan R. Maund | 386 | 20.5 | +5.2 | |
| Liberal Democrats | Roger L. Axworthy | 160 | 8.5 | -0.7 | |
| Majority | 953 | 50.5 | -4.8 | ||
| Turnout | 1,885 | 16.8 | |||
| Labour hold | Swing | ||||
The by-election was called following the death of Cllr. Thomas A. McKendry.
Edgware
| Party | Candidate | Votes | % | ±% | |
|---|---|---|---|---|---|
| Conservative | Anthony P. Spencer | 1,189 | 48.4 | ||
| Labour | Alan M. Sloam | 1,129 | 46.0 | ||
| Liberal Democrats | Geoffrey A. Jacobs | 138 | 5.6 | ||
| Majority | 60 | 2.4 | |||
| Turnout | 2,456 | 21.1 | |||
| Conservative hold | Swing | ||||
The by-election was called following the resignation of Cllr. Julian D. Czarny.
Hendon
| Party | Candidate | Votes | % | ±% | |
|---|---|---|---|---|---|
| Conservative | Andrew M. Sherling | 970 | 36.2 | ||
| Labour | Colin S. Francome | 885 | 33.1 | ||
| Liberal Democrats | Susan J. Palin | 821 | 30.7 | ||
| Majority | 85 | 3.1 | |||
| Turnout | 2,676 | 22.7 | |||
| Conservative hold | Swing | ||||
The by-election was called following the resignation of Cllr. Edward P. Bunn.
References
- ↑ Mason, Rowena; Stewart, Heather (30 April 2022). "Rebel Tory MPs fear Boris Johnson could trigger autumn general election". The Guardian. London. Archived from the original on 1 May 2022. Retrieved 2 May 2022.
- ↑ Minors, Michael; Grenham, Dennis. "London Borough Council Elections 7 May 1998 including the Greater London Authority Referendum results" (PDF). Demographic and Statistical Studies. London Research Centre. Archived (PDF) from the original on 22 February 2015. Retrieved 22 February 2015.
- 1 2 3 4 "London Borough Council Elections 7 May 1998 including the Greater London Authority Referendum results" (PDF). London Datastore. London Research Centre. Archived (PDF) from the original on 22 February 2015. Retrieved 8 March 2015.
| London boroughs |
|
|---|---|
| Metropolitan boroughs |
|
| District councils (England) |
|
| Regional councils (Scotland) | |
| Referendum | |
| |
This article is issued from Wikipedia. The text is licensed under Creative Commons - Attribution - Sharealike. Additional terms may apply for the media files.