| |||||||||||||||||||||||||||||||||
15 of the 44 seats in the Derby City Council 23 seats needed for a majority | |||||||||||||||||||||||||||||||||
|---|---|---|---|---|---|---|---|---|---|---|---|---|---|---|---|---|---|---|---|---|---|---|---|---|---|---|---|---|---|---|---|---|---|
| |||||||||||||||||||||||||||||||||
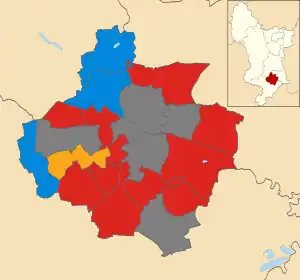 Map showing the results of the 1994 Derby City Council elections. | |||||||||||||||||||||||||||||||||
| |||||||||||||||||||||||||||||||||
The 1994 Derby City Council election took place on 5 May 1994 to elect members of Derby City Council in England. Local elections were held in the United Kingdom in 1994.[3] This was on the same day as other local elections. The Labour Party gained control of the council, which had previously been under no overall control.
Overall results
| Party | Seats | Gains | Losses | Net gain/loss | Seats % | Votes % | Votes | +/− | |
|---|---|---|---|---|---|---|---|---|---|
| Labour | 11 | 2 | 0 | 73.3 | 52.1 | 28,423 | |||
| Conservative | 3 | 0 | 3 | 20.0 | 30.3 | 16,521 | |||
| Liberal Democrats | 1 | 1 | 0 | 6.7 | 17.3 | 9,414 | |||
| National Front | 0 | 0 | 0 | 0.0 | 0.2 | 95 | |||
| SDP | 0 | 0 | 0 | 0.0 | 0.1 | 57 | |||
| Total | 15 | 54,510 | |||||||
Ward results
Abbey
Location of Abbey ward
| Party | Candidate | Votes | % | |
|---|---|---|---|---|
| Labour | M. Walker | 2,186 | 69.1% | |
| Conservative | D. Sice | 627 | 19.8% | |
| Liberal Democrats | D. Lilley | 350 | 11.1% | |
| Turnout | 33.7% | |||
| Labour hold | ||||
Allestree

Location of Allestree ward
| Party | Candidate | Votes | % | |
|---|---|---|---|---|
| Conservative | G. Du Sautoy | 1,963 | 52.6% | |
| Labour | K. Merry | 998 | 26.7% | |
| Liberal Democrats | S. King | 772 | 20.7% | |
| Turnout | 47.2% | |||
| Conservative hold | ||||
Alvaston

Location of Alvaston ward
| Party | Candidate | Votes | % | |
|---|---|---|---|---|
| Labour | C. Wynn | 1,830 | 60.2% | |
| Conservative | B. Matsell | 804 | 26.5% | |
| Liberal Democrats | B. Phelan | 404 | 13.3% | |
| Turnout | 38.3% | |||
| Labour hold | ||||
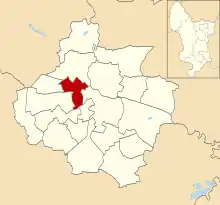
Babington

Location of Babington ward
| Party | Candidate | Votes | % | |
|---|---|---|---|---|
| Labour | V. Wilsoncroft | 1,684 | 67.7% | |
| Conservative | M. Yaqub | 546 | 21.9% | |
| Liberal Democrats | M. Sherazi | 259 | 10.4% | |
| Turnout | 34.1% | |||
| Labour hold | ||||
Blagreaves

Location of Blagreaves ward
| Party | Candidate | Votes | % | |
|---|---|---|---|---|
| Labour | M. Redfern | 2,253 | 47.3% | |
| Liberal Democrats | A. Spendlove | 1,262 | 26.5% | |
| Conservative | J. Keith | 1,247 | 26.2% | |
| Turnout | 59.2% | |||
| Labour gain from Conservative | ||||
Boulton

Location of Boulton ward
| Party | Candidate | Votes | % | |
|---|---|---|---|---|
| Labour | A. Kennedy | 2,286 | 59.2% | |
| Conservative | M. Axelrod | 1,017 | 26.3% | |
| Liberal Democrats | P. Harlow | 560 | 14.5% | |
| Turnout | 44.4% | |||
| Labour hold | ||||
Breadsall

Location of Breadsall ward
| Party | Candidate | Votes | % | |
|---|---|---|---|---|
| Labour | J. Whitby | 3,619 | 54.6% | |
| Conservative | C. Pallett | 2,164 | 32.6% | |
| Liberal Democrats | M. Harris | 850 | 12.8% | |
| Turnout | 43.8% | |||
| Labour hold | ||||
Darley

Location of Darley ward
| Party | Candidate | Votes | % | |
|---|---|---|---|---|
| Conservative | S. Hart | 1,943 | 45.1% | |
| Labour | E. Wooley | 1,453 | 33.7% | |
| Liberal Democrats | R. Pratt | 916 | 21.2% | |
| Turnout | 46.5% | |||
| Conservative hold | ||||
Littleover

Location of Littleover ward
| Party | Candidate | Votes | % | |
|---|---|---|---|---|
| Liberal Democrats | M. Burgess | 1,823 | 46.7% | |
| Conservative | G. Shaw | 1,094 | 28.0% | |
| Labour | A. Cotton | 933 | 23.9% | |
| SDP | K. Dickenson | 57 | 1.5% | |
| Turnout | 49.0% | |||
| Liberal Democrats gain from Conservative | ||||
Mackworth
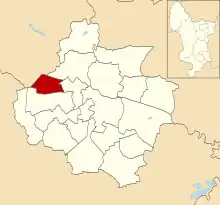
Location of Mackworth ward
| Party | Candidate | Votes | % | |
|---|---|---|---|---|
| Labour | R. Baxter | 1,953 | 69.5% | |
| Conservative | A. Clemson | 543 | 19.3% | |
| Liberal Democrats | L. Alcock | 218 | 7.8% | |
| National Front | G. Hardy | 95 | 3.4% | |
| Turnout | 43.1% | |||
| Labour hold | ||||
Mickleover

Location of Mickleover ward
| Party | Candidate | Votes | % | |
|---|---|---|---|---|
| Conservative | N. Keene | 1,542 | 41.4% | |
| Labour | P. Taylor | 1,468 | 39.5% | |
| Liberal Democrats | A. Wilbraham | 711 | 19.1% | |
| Turnout | 44.7% | |||
| Conservative hold | ||||
Normanton

Location of Normanton ward
| Party | Candidate | Votes | % | |
|---|---|---|---|---|
| Labour | S. Bolton | 1,928 | 70.7% | |
| Conservative | A. Javed | 458 | 16.8% | |
| Liberal Democrats | A. Cooper | 342 | 12.5% | |
| Turnout | 37.0% | |||
| Labour hold | ||||
Osmaston

Location of Osmaston ward
| Party | Candidate | Votes | % | |
|---|---|---|---|---|
| Labour | R. Laxton | 1,374 | 77.6% | |
| Conservative | H. Wakefield | 227 | 12.8% | |
| Liberal Democrats | E. Ashburner | 169 | 9.5% | |
| Turnout | 28.7% | |||
| Labour hold | ||||
Sinfin

Location of Sinfin ward
| Party | Candidate | Votes | % | |
|---|---|---|---|---|
| Labour | N. Dhindsa | 1,919 | 69.7% | |
| Conservative | A. Pegg | 494 | 17.9% | |
| Liberal Democrats | R. Troup | 340 | 12.4% | |
| Turnout | 36.5% | |||
| Labour hold | ||||
Spondon

Location of Spondon ward
| Party | Candidate | Votes | % | |
|---|---|---|---|---|
| Labour | M. Byrne | 2,539 | 52.6% | |
| Conservative | D. Dickinson | 1,852 | 38.4% | |
| Liberal Democrats | P. Hill | 438 | 9.1% | |
| Turnout | 49.0% | |||
| Labour gain from Conservative | ||||
References
- ↑ "Council compositions by year". The Elections Centre.
- ↑ "Local Election Summaries 1994". The Elections Centre.
- ↑ Rallings, Colin; Thrasher, Michael. Local Elections Handbook 1994 (PDF). The Elections Centre. Retrieved 21 February 2020.
- 1 2 3 4 5 6 7 8 9 10 11 12 13 14 15 "Derby City Council Election Results 1979-1995" (PDF). Elections Centre.
| London boroughs |
|
|---|---|
| Metropolitan boroughs |
|
| District councils (England) |
|
| Regional councils (Scotland) | |
| Referendum | |
| |
This article is issued from Wikipedia. The text is licensed under Creative Commons - Attribution - Sharealike. Additional terms may apply for the media files.