| |||||||||||||||||||||||||||||
All 48 seats 25 seats needed for a majority | |||||||||||||||||||||||||||||
|---|---|---|---|---|---|---|---|---|---|---|---|---|---|---|---|---|---|---|---|---|---|---|---|---|---|---|---|---|---|
| |||||||||||||||||||||||||||||
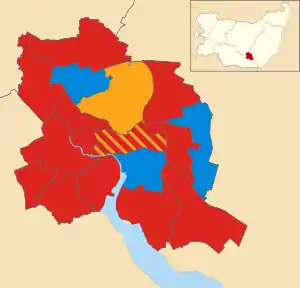 Map showing the 2002 local election results in Ipswich. | |||||||||||||||||||||||||||||
| |||||||||||||||||||||||||||||
The 2002 Ipswich Borough Council election was an election for Ipswich Borough Council held on 2 May 2002. The whole council was up for election with boundary changes since the last election in 2000. The Labour Party kept overall control of the council.
Election result

Election apportionment diagram
| Party | Seats | Gains | Losses | Net gain/loss | Seats % | Votes % | Votes | +/− | |
|---|---|---|---|---|---|---|---|---|---|
| Labour | 35 | +3 | 72.9 | 41.1 | 33,082 | ||||
| Conservative | 9 | -4 | 18.8 | 37.4 | 30,150 | ||||
| Liberal Democrats | 4 | +1 | 8.3 | 20.7 | 16,675 | ||||
| CPA | 0 | 0 | 0 | 0.6 | 519 | ||||
| Green | 0 | 0 | 0 | 0.2 | 143 | ||||
Ward results
Alexandra
| Party | Candidate | Votes | % | |
|---|---|---|---|---|
| Labour | Penelope Breakwell | 794 | ||
| Labour | Maureen Carrington-Brown | 720 | ||
| Liberal Democrats | Jane Chambers | 687 | ||
| Liberal Democrats | Kenneth Toye | 675 | ||
| Labour | Dianne Hosking | 672 | ||
| Liberal Democrats | Robin Whitmore | 651 | ||
| Conservative | Susan Rush | 355 | ||
| Conservative | Maureen Springle | 328 | ||
| Conservative | Margaret Saunders | 316 | ||
| Turnout | 5,198 | |||
Bixley
| Party | Candidate | Votes | % | |
|---|---|---|---|---|
| Conservative | William Wright | 1,285 | ||
| Conservative | Gordon Terry | 1,220 | ||
| Conservative | Stephen Barker | 1,199 | ||
| Liberal Democrats | Adam Beaton | 522 | ||
| Labour | Colin Campbell | 502 | ||
| Labour | Susan Maguire | 463 | ||
| Liberal Democrats | John Rivett | 451 | ||
| Labour | Susan Smart | 450 | ||
| Liberal Democrats | Brian Fearnley | 354 | ||
| CPA | Dave Cooper | 220 | ||
| Turnout | 6,666 | |||
Bridge
| Party | Candidate | Votes | % | |
|---|---|---|---|---|
| Labour | James Powell | 764 | ||
| Labour | Harold Mangar | 690 | ||
| Labour | Philip Smart | 676 | ||
| Conservative | Andrew Booth | 402 | ||
| Conservative | Albie Kingham | 382 | ||
| Conservative | Maureen Mott | 376 | ||
| Liberal Democrats | Elisabeth Williams | 248 | ||
| Liberal Democrats | Juliet Lloyd | 246 | ||
| Liberal Democrats | Denise Earle | 221 | ||
| Turnout | 4,005 | |||
Castle Hill
| Party | Candidate | Votes | % | |
|---|---|---|---|---|
| Conservative | Henry Davies | 1,160 | ||
| Conservative | Dale Jackson | 1,079 | ||
| Conservative | David Goldsmith | 1,053 | ||
| Labour | Mary Manuel | 653 | ||
| Labour | James Adams | 573 | ||
| Labour | Peter Shaw | 528 | ||
| Liberal Democrats | Nina Day | 361 | ||
| Liberal Democrats | John Goodall | 264 | ||
| Liberal Democrats | Clive Whitter | 235 | ||
| Turnout | 5,906 | |||
Gainsborough
| Party | Candidate | Votes | % | |
|---|---|---|---|---|
| Labour | Sally Brown | 902 | ||
| Labour | John Mowles | 892 | ||
| Labour | Don Edwards | 883 | ||
| Conservative | William Cook | 453 | ||
| Conservative | Keith Matthews | 423 | ||
| Conservative | Nico Mott | 405 | ||
| Liberal Democrats | Louise Gooch | 164 | ||
| Liberal Democrats | Nicholas Jacob | 138 | ||
| Liberal Democrats | Charles Tracy | 127 | ||
| Turnout | 4,387 | |||
Gipping
| Party | Candidate | Votes | % | |
|---|---|---|---|---|
| Labour | Jeanette Macartney | 776 | ||
| Labour | David Ellesmere | 754 | ||
| Labour | Peter Gardiner | 753 | ||
| Conservative | Michael Irvine | 369 | ||
| Conservative | Helen Last | 347 | ||
| Conservative | Robert Strutt | 333 | ||
| Liberal Democrats | Jill Atkins | 224 | ||
| Liberal Democrats | Donald Perkins | 202 | ||
| Liberal Democrats | Amy Luke | 194 | ||
| Turnout | 3,952 | |||
Holywells
| Party | Candidate | Votes | % | |
|---|---|---|---|---|
| Conservative | George Debman | 792 | ||
| Conservative | David Hale | 760 | ||
| Conservative | Elizabeth Harsant | 745 | ||
| Labour | John Cook | 532 | ||
| Labour | Robert Daines | 506 | ||
| Labour | Richard Kirby | 477 | ||
| Liberal Democrats | Catherine Chambers | 254 | ||
| Liberal Democrats | Velina Walden | 206 | ||
| Liberal Democrats | Bob Zablok | 184 | ||
| Turnout | 4,456 | |||
Priory Heath
| Party | Candidate | Votes | % | |
|---|---|---|---|---|
| Labour | Bradley Maguire | 603 | ||
| Labour | William Quinton | 601 | ||
| Labour | Dale Jabbar | 588 | ||
| Conservative | Sarah Dodwell | 412 | ||
| Conservative | Peter Rush | 369 | ||
| Conservative | Benjamin Redsell | 359 | ||
| Liberal Democrats | Frank Atkins | 231 | ||
| Liberal Democrats | Catherine French | 220 | ||
| Liberal Democrats | Martin Pakes | 194 | ||
| Turnout | 3,577 | |||
Rushmere
| Party | Candidate | Votes | % | |
|---|---|---|---|---|
| Labour | Robert Ray-Dobson | 924 | ||
| Labour | Keith Herod | 868 | ||
| Labour | David Isaacs | 842 | ||
| Conservative | Mark Rush | 838 | ||
| Conservative | Stephen Ion | 823 | ||
| Conservative | Keith Wood | 767 | ||
| Liberal Democrats | Gillian Auton | 467 | ||
| Liberal Democrats | Roberta Kerslake | 400 | ||
| Liberal Democrats | Graham Lucas | 333 | ||
| CPA | Stephen Bloomfield | 182 | ||
| Turnout | 6,444 | |||
St Johns
| Party | Candidate | Votes | % | |
|---|---|---|---|---|
| Labour | Alexander Martin | 892 | ||
| Labour | Elizabeth Cooper | 875 | ||
| Labour | Neil MacDonald | 868 | ||
| Conservative | Stephen Cook | 740 | ||
| Conservative | Edward Phillips | 698 | ||
| Conservative | Carlton Vajzovic | 637 | ||
| Liberal Democrats | Elizabeth Hubbard | 316 | ||
| Liberal Democrats | David Kitchen | 267 | ||
| Liberal Democrats | John Whitear | 233 | ||
| Green | Jack Phipps | 143 | ||
| CPA | Gavin Stone | 117 | ||
| Turnout | 5,786 | |||
St Margaret's
| Party | Candidate | Votes | % | |
|---|---|---|---|---|
| Liberal Democrats | Inga Lockington | 1,366 | ||
| Liberal Democrats | Richard Atkins | 1,222 | ||
| Liberal Democrats | John Cooper | 1,191 | ||
| Conservative | David Brown | 1,093 | ||
| Conservative | Jeffrey Stansfield | 1,049 | ||
| Conservative | Carole Leggett | 993 | ||
| Labour | Jane Shaw | 386 | ||
| Labour | Adele Cook | 382 | ||
| Labour | Steve Reynolds | 380 | ||
| Turnout | 8,062 | |||
Sprites
| Party | Candidate | Votes | % | |
|---|---|---|---|---|
| Labour | Ian Grimwood | 915 | ||
| Labour | Richard Risebrow | 860 | ||
| Labour | John Le Grys | 858 | ||
| Conservative | Bob Hall | 529 | ||
| Conservative | Roy Dovaston | 511 | ||
| Conservative | Kathleen Kenna | 507 | ||
| Liberal Democrats | Gwynne Chipperfield | 226 | ||
| Liberal Democrats | Philip Richardson | 217 | ||
| Liberal Democrats | James Williams | 201 | ||
| Turnout | 4,824 | |||
Stoke Park
| Party | Candidate | Votes | % | |
|---|---|---|---|---|
| Labour | Roger Fern | 754 | ||
| Labour | Barry Studd | 738 | ||
| Labour | Keith Rawlingson | 730 | ||
| Conservative | Duncan Titchmarsh | 638 | ||
| Conservative | Paul West | 638 | ||
| Conservative | Don Ward | 616 | ||
| Liberal Democrats | David Mullett | 267 | ||
| Liberal Democrats | Catherine Stafford | 219 | ||
| Liberal Democrats | Tim Starkey | 211 | ||
| Turnout | 4,811 | |||
Westgate
| Party | Candidate | Votes | % | |
|---|---|---|---|---|
| Labour | Mary Blake | 716 | ||
| Labour | John Harris | 654 | ||
| Labour | Martin Cook | 651 | ||
| Conservative | Julia Schubert | 414 | ||
| Conservative | Stella Fuller | 393 | ||
| Conservative | Robert Watson | 381 | ||
| Liberal Democrats | Dennis Day | 256 | ||
| Liberal Democrats | Timothy Lockington | 248 | ||
| Liberal Democrats | Cynthia Toye | 238 | ||
| Turnout | 3,951 | |||
Whitehouse
| Party | Candidate | Votes | % | |
|---|---|---|---|---|
| Labour | Albert Grant | 574 | ||
| Labour | Trevor Payne | 561 | ||
| Labour | Christopher Newbury | 513 | ||
| Liberal Democrats | George King | 364 | ||
| Conservative | Colin Morgan | 356 | ||
| Conservative | Mary Young | 322 | ||
| Conservative | Tracy Rivers | 313 | ||
| Liberal Democrats | Charlie Blue | 281 | ||
| Liberal Democrats | Michael Higgins | 246 | ||
| Turnout | 3,530 | |||
Whitton
| Party | Candidate | Votes | % | |
|---|---|---|---|---|
| Labour | George Clarke | 814 | ||
| Labour | Graham Manuel | 809 | ||
| Labour | Martyn Green | 766 | ||
| Conservative | Sandie Doyle | 686 | ||
| Conservative | Neville Jackson | 649 | ||
| Conservative | Stephen Lark | 637 | ||
| Liberal Democrats | Adrian Brown | 248 | ||
| Liberal Democrats | Santa Richardson | 210 | ||
| Liberal Democrats | Julie Fletcher | 195 | ||
| Turnout | 5,014 | |||
References
Election Results 1973-2012]
| Suffolk County Council | |
|---|---|
| Babergh District Council | |
| East Suffolk District Council | |
| Ipswich Borough Council | |
| Mid Suffolk District Council | |
| West Suffolk District Council | |
| East Suffolk County Council |
|
| Forest Heath District Council | |
| St Edmundsbury Borough Council | |
| Suffolk Coastal District Council | |
| Waveney District Council | |
| West Suffolk County Council |
|
| |
This article is issued from Wikipedia. The text is licensed under Creative Commons - Attribution - Sharealike. Additional terms may apply for the media files.