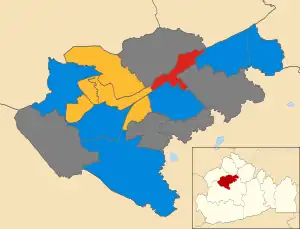
Map of the results of the 2002 Woking council election. Conservatives in blue, Liberal Democrats in yellow and Labour in red. Wards in grey were not contested in 2002.
The 2002 Woking Council election took place on 2 May 2002 to elect members of Woking Borough Council in Surrey, England. One third of the council was up for election and the council stayed under no overall control.[1] Overall turnout in the election was 33.28%, down from 34.32% in 2000.[2]
After the election, the composition of the council was:
- Conservative 17
- Liberal Democrat 13
- Labour 5
- Independent 1[3]
Election result
| Party | Seats | Gains | Losses | Net gain/loss | Seats % | Votes % | Votes | +/− | |
|---|---|---|---|---|---|---|---|---|---|
| Conservative | 6 | 1 | 0 | +1 | 46.2 | 44.9 | 8,488 | -0.1% | |
| Liberal Democrats | 6 | 0 | 1 | -1 | 46.2 | 39.5 | 7,483 | +2.7% | |
| Labour | 1 | 0 | 0 | 0 | 7.7 | 13.8 | 2,605 | -2.0% | |
| UKIP | 0 | 0 | 0 | 0 | 0 | 1.1 | 211 | +1.1% | |
| Independent | 0 | 0 | 0 | 0 | 0 | 0.7 | 137 | -1.8% | |
Ward results
| Party | Candidate | Votes | % | ±% | |
|---|---|---|---|---|---|
| Conservative | Todd | 953 | 48.1 | ||
| Liberal Democrats | Anne Roberts | 787 | 39.7 | ||
| Labour | Michael Roberts | 241 | 12.2 | ||
| Majority | 166 | 8.4 | |||
| Turnout | 1,981 | 36.2 | |||
| Conservative gain from Liberal Democrats | Swing | ||||
| Party | Candidate | Votes | % | ±% | |
|---|---|---|---|---|---|
| Liberal Democrats | Cross | 797 | 49.8 | ||
| Conservative | Bellord | 488 | 30.5 | ||
| Labour | Ford | 316 | 19.7 | ||
| Majority | 309 | 19.3 | |||
| Turnout | 1,601 | 29.7 | |||
| Liberal Democrats hold | Swing | ||||
| Party | Candidate | Votes | % | ±% | |
|---|---|---|---|---|---|
| Liberal Democrats | Landon | 485 | 58.2 | ||
| Conservative | Lawrence | 266 | 31.9 | ||
| Labour | Wand | 83 | 10.0 | ||
| Majority | 219 | 26.3 | |||
| Turnout | 834 | 22.0 | |||
| Liberal Democrats hold | Swing | ||||
| Party | Candidate | Votes | % | ±% | |
|---|---|---|---|---|---|
| Liberal Democrats | Howard | 695 | |||
| Liberal Democrats | Liddington | 643 | |||
| Conservative | Fisher | 366 | |||
| Conservative | Assi | 317 | |||
| Labour | Carman | 159 | |||
| Labour | Martin | 147 | |||
| Turnout | 2,327 | 30.6 | |||
| Liberal Democrats hold | Swing | ||||
| Liberal Democrats hold | Swing | ||||
| Party | Candidate | Votes | % | ±% | |
|---|---|---|---|---|---|
| Liberal Democrats | Sanderson | 1,174 | 48.1 | ||
| Conservative | Atkins | 1,047 | 42.9 | ||
| Labour | Worgan | 131 | 5.4 | ||
| UKIP | Shaw | 88 | 3.6 | ||
| Majority | 127 | 5.2 | |||
| Turnout | 2,440 | 46.2 | |||
| Liberal Democrats hold | Swing | ||||
| Party | Candidate | Votes | % | ±% | |
|---|---|---|---|---|---|
| Conservative | Hayes-Allen | 849 | 45.2 | ||
| Liberal Democrats | Shoraka | 816 | 43.5 | ||
| Labour | Allan | 213 | 11.3 | ||
| Majority | 33 | 1.7 | |||
| Turnout | 1,878 | 28.7 | |||
| Conservative hold | Swing | ||||
| Party | Candidate | Votes | % | ±% | |
|---|---|---|---|---|---|
| Labour | Pope | 950 | 59.1 | ||
| Conservative | Roe | 293 | 18.2 | ||
| Liberal Democrats | Morales | 227 | 14.1 | ||
| Independent | Osman | 137 | 8.5 | ||
| Majority | 657 | 40.9 | |||
| Turnout | 1,607 | 24.8 | |||
| Labour hold | Swing | ||||
| Party | Candidate | Votes | % | ±% | |
|---|---|---|---|---|---|
| Conservative | Palmer | 653 | 75.0 | -0.5 | |
| Liberal Democrats | Leach | 151 | 17.3 | -1.0 | |
| UKIP | Davey | 34 | 3.9 | +3.9 | |
| Labour | Kendall | 33 | 3.8 | -2.5 | |
| Majority | 502 | 57.7 | +0.5 | ||
| Turnout | 871 | 44.9 | |||
| Conservative hold | Swing | ||||
| Party | Candidate | Votes | % | ±% | |
|---|---|---|---|---|---|
| Conservative | Bittleston | 728 | 60.6 | ||
| Liberal Democrats | Wilson | 329 | 27.4 | ||
| Labour | Kennedy | 90 | 7.5 | ||
| UKIP | Squire | 54 | 4.5 | ||
| Majority | 399 | 33.2 | |||
| Turnout | 1,201 | 34.1 | |||
| Conservative hold | Swing | ||||
| Party | Candidate | Votes | % | ±% | |
|---|---|---|---|---|---|
| Liberal Democrats | Smith | 756 | 50.5 | ||
| Conservative | Hopkins | 635 | 42.4 | ||
| Labour | Kapor | 72 | 4.8 | ||
| UKIP | Squire | 35 | 2.3 | ||
| Majority | 121 | 8.1 | |||
| Turnout | 1,498 | 40.6 | |||
| Liberal Democrats hold | Swing | ||||
| Party | Candidate | Votes | % | ±% | |
|---|---|---|---|---|---|
| Conservative | Kingsbury | 856 | 69.1 | ||
| Liberal Democrats | Kremer | 308 | 24.9 | ||
| Labour | Bramall | 74 | 6.0 | ||
| Majority | 548 | 44.2 | |||
| Turnout | 1,238 | 35.2 | |||
| Conservative hold | Swing | ||||
| Party | Candidate | Votes | % | ±% | |
|---|---|---|---|---|---|
| Conservative | Popham | 1,037 | 71.6 | ||
| Liberal Democrats | Grimshaw | 315 | 21.8 | ||
| Labour | Byrne | 96 | 6.6 | ||
| Majority | 722 | 49.8 | |||
| Turnout | 1,448 | 36.9 | |||
| Conservative hold | Swing | ||||
References
- ↑ "Woking". BBC News Online. Retrieved 20 January 2010.
- 1 2 3 4 5 6 7 8 9 10 11 12 13 14 "Election various wards Thursday 2 May 2002: Results" (PDF). Woking Borough Council. Archived from the original (PDF) on 7 January 2011. Retrieved 20 January 2010.
- 1 2 "Election results; Local Election". The Times. 4 May 2002. p. 16.
This article is issued from Wikipedia. The text is licensed under Creative Commons - Attribution - Sharealike. Additional terms may apply for the media files.