| |||||||||||||||||||||||||||||||||
13 of the 39 seats to Stevenage Borough Council 20 seats needed for a majority | |||||||||||||||||||||||||||||||||
|---|---|---|---|---|---|---|---|---|---|---|---|---|---|---|---|---|---|---|---|---|---|---|---|---|---|---|---|---|---|---|---|---|---|
| |||||||||||||||||||||||||||||||||
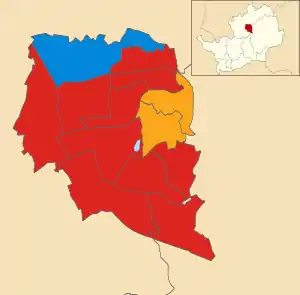
 Map showing the results of contested wards in the 2004 Stevenage Borough Council elections. | |||||||||||||||||||||||||||||||||
| |||||||||||||||||||||||||||||||||
Elections to Stevenage Council were held on 10 June 2004. One third of the council was up for election; the seats which were last contested in 2000. The Labour Party stayed in overall control of the council.
After the election, the composition of the council was:
- Labour 32
- Liberal Democrat 4
- Conservative 3
Election result
| Party | Seats | Gains | Losses | Net gain/loss | Seats % | Votes % | Votes | +/− | |
|---|---|---|---|---|---|---|---|---|---|
| Labour | 10 | -1 | 76.9 | 39.8 | 8,749 | -7.9% | |||
| Liberal Democrats | 2 | +1 | 15.4 | 28.3 | 6,224 | +2.9% | |||
| Conservative | 1 | 0 | 7.7 | 29.4 | 6,460 | +4.3% | |||
| Green | 0 | 0 | 0 | 1.9 | 413 | +0.5% | |||
| Socialist Alternative | 0 | 0 | 0 | 0.5 | 119 | +0.1% | |||
Ward results
Bandley Hill

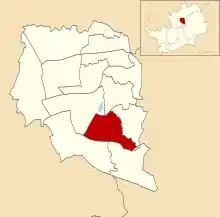
Location of Bandley Hill ward
| Party | Candidate | Votes | % | ±% | |
|---|---|---|---|---|---|
| Labour | Lillian Strange | 739 | 45.0 | -7.2 | |
| Conservative | Mollie Cawthorn | 558 | 34.0 | +5.1 | |
| Liberal Democrats | Sean McManus | 345 | 21.0 | +2.1 | |
| Majority | 181 | 11.0 | -12.3 | ||
| Turnout | 1,642 | 35.1 | -11.9 | ||
Bedwell

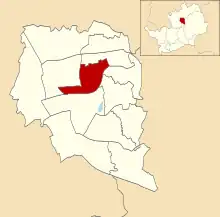
Location of Bedwell ward
| Party | Candidate | Votes | % | ±% | |
|---|---|---|---|---|---|
| Labour | David Cullen | 869 | 49.3 | -10.2 | |
| Conservative | Christine Saint-Leitner | 408 | 23.2 | +4.5 | |
| Liberal Democrats | John Meacham | 365 | 20.7 | +3.7 | |
| Socialist Alternative | Stephen Glennon | 119 | 6.8 | +2.0 | |
| Majority | 461 | 26.1 | -14.7 | ||
| Turnout | 1,761 | 38.7 | -11.6 | ||
Chells

Location of Chells ward
| Party | Candidate | Votes | % | ±% | |
|---|---|---|---|---|---|
| Liberal Democrats | Leonard Lambert | 828 | 45.6 | +12.9 | |
| Labour | Jeannette Thomas | 643 | 35.4 | -16.5 | |
| Conservative | Jody Hanafin | 344 | 19.0 | +3.6 | |
| Majority | 185 | 10.2 | |||
| Turnout | 1,815 | 40.5 | -15.1 | ||
| Liberal Democrats gain from Labour | Swing | ||||
Longmeadow

Location of Longmeadow ward
| Party | Candidate | Votes | % | ±% | |
|---|---|---|---|---|---|
| Labour | Bruce Jackson | 619 | 36.6 | -10.0 | |
| Conservative | Matthew Hurst | 606 | 35.9 | +7.8 | |
| Liberal Democrats | Ralph Baskerville | 464 | 27.5 | +2.2 | |
| Majority | 13 | 0.7 | -17.8 | ||
| Turnout | 1,689 | 39.6 | -12.2 | ||
Manor

Location of Manor ward
| Party | Candidate | Votes | % | ±% | |
|---|---|---|---|---|---|
| Liberal Democrats | Graham Snell | 1,232 | 59.2 | -7.1 | |
| Conservative | Prudence Howells | 458 | 22.0 | +5.2 | |
| Labour | Howard Burrell | 392 | 18.8 | +2.0 | |
| Majority | 774 | 37.2 | -12.3 | ||
| Turnout | 2,082 | 43.9 | -14.1 | ||
Martins Wood

Location of Martins Wood ward
| Party | Candidate | Votes | % | ±% | |
|---|---|---|---|---|---|
| Labour | David Royall | 585 | 35.5 | -7.3 | |
| Conservative | Ralph Dimelow | 526 | 31.9 | +2.3 | |
| Liberal Democrats | Barbara Segadelli | 330 | 20.0 | +2.0 | |
| Green | Ian Murrill | 207 | 12.6 | +3.0 | |
| Majority | 59 | 3.6 | -9.6 | ||
| Turnout | 1,648 | 37.2 | -11.8 | ||
Old Town

Location of Old Town ward
| Party | Candidate | Votes | % | ±% | |
|---|---|---|---|---|---|
| Labour | Hugh Tessier | 870 | 40.4 | -6.0 | |
| Conservative | Dilys Clark | 746 | 34.6 | +6.9 | |
| Liberal Democrats | Jennifer Moorcroft | 333 | 15.5 | -2.4 | |
| Green | Bernard Chapman | 206 | 9.6 | +1.6 | |
| Majority | 124 | 5.8 | -12.9 | ||
| Turnout | 2,155 | 46.3 | -11.0 | ||
Pin Green

Location of Pin Green ward
| Party | Candidate | Votes | % | ±% | |
|---|---|---|---|---|---|
| Labour | Simon Speller | 762 | 46.5 | -7.5 | |
| Conservative | Leslie Clark | 503 | 30.7 | +6.1 | |
| Liberal Democrats | Mary Griffith | 375 | 22.9 | +1.6 | |
| Majority | 259 | 15.8 | -13.6 | ||
| Turnout | 1,640 | 37.7 | -14.5 | ||
Roebuck

Location of Roebuck ward
| Party | Candidate | Votes | % | ±% | |
|---|---|---|---|---|---|
| Labour | John Lloyd | 760 | 44.5 | -5.2 | |
| Conservative | Anita Speight | 505 | 29.6 | +4.0 | |
| Liberal Democrats | Gordon Knight | 441 | 25.8 | +1.1 | |
| Majority | 255 | 14.9 | -9.2 | ||
| Turnout | 1,706 | 39.3 | -9.7 | ||
St Nicholas

Location of St Nicholas ward
| Party | Candidate | Votes | % | ±% | |
|---|---|---|---|---|---|
| Labour | Richard Henry | 586 | 41.2 | -7.3 | |
| Conservative | Ian Pritchard | 421 | 29.6 | +4.5 | |
| Liberal Democrats | Heather Snell | 414 | 29.1 | +2.6 | |
| Majority | 165 | 11.6 | -10.4 | ||
| Turnout | 1,421 | 33.9 | -13.1 | ||
Shephall

Location of Shephall ward
| Party | Candidate | Votes | % | ±% | |
|---|---|---|---|---|---|
| Labour | Jack Pickersgill | 838 | 52.6 | -8.6 | |
| Conservative | Freda Warner | 392 | 24.6 | +5.2 | |
| Liberal Democrats | Nicholas Baskerville | 362 | 22.7 | +3.3 | |
| Majority | 446 | 28.0 | -13.8 | ||
| Turnout | 1,592 | 37.2 | -14.5 | ||
Symonds Green

Location of Symonds Green ward
| Party | Candidate | Votes | % | ±% | |
|---|---|---|---|---|---|
| Labour | Anthony Turner | 784 | 46.6 | -13.9 | |
| Conservative | Galina Dimelow | 555 | 33.0 | +8.5 | |
| Liberal Democrats | Katherine Lloyd | 342 | 20.3 | +5.4 | |
| Majority | 229 | 13.6 | -22.4 | ||
| Turnout | 1,681 | 38.6 | -15.1 | ||
Woodfield

Location of Woodfield ward
| Party | Candidate | Votes | % | ±% | |
|---|---|---|---|---|---|
| Conservative | Margaret Notley | 830 | 54.4 | +8.2 | |
| Liberal Democrats | Audrey Griffith | 393 | 25.8 | +7.5 | |
| Labour | Ashraf Ismail | 302 | 19.8 | -15.7 | |
| Majority | 437 | 28.6 | +17.9 | ||
| Turnout | 1,525 | 39.6 | -16.7 | ||
References
This article is issued from Wikipedia. The text is licensed under Creative Commons - Attribution - Sharealike. Additional terms may apply for the media files.