| |||||||||||||||||||
11 seats on the Cuyahoga County Council 6 seats needed for a majority | |||||||||||||||||||
|---|---|---|---|---|---|---|---|---|---|---|---|---|---|---|---|---|---|---|---|
| Turnout | 44.2%[1] | ||||||||||||||||||
| |||||||||||||||||||
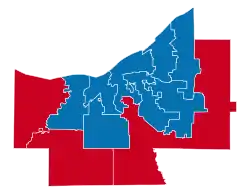 Results: Democratic gain Republican gain | |||||||||||||||||||
| |||||||||||||||||||
| Elections in Ohio |
|---|
.svg.png.webp) |
The 2010 Cuyahoga County Council election was held on November 2, 2010 to elect all 11 members of the newly formed County Council of Cuyahoga County, Ohio. This was the first held under the newly ratified Charter of Cuyahoga County, which replaced Cuyahoga's 200 year old Board of County Commissioners with an executive and legislature.[2]
Democrats won control of the body with 8 seats to the 3 won by Republicans.[3]
District 1
Democratic primary
Primary results
| Party | Candidate | Votes | % | |
|---|---|---|---|---|
| Democratic | Nicole Dailey Jones | 3,340 | 34.41% | |
| Democratic | Maureen M. Sweeney | 2,152 | 22.24% | |
| Democratic | James H. French | 1,768 | 18.27% | |
| Democratic | Pete Matia | 1,374 | 14.20% | |
| Democratic | Dennis M. Lambert | 664 | 6.86% | |
| Democratic | Walt Halun | 380 | 3.93% | |
| Total votes | 9,678 | 100.00 | ||
Republican primary
Primary results
| Party | Candidate | Votes | % | |
|---|---|---|---|---|
| Republican | Dave Greenspan | 4,065 | 41.22% | |
| Republican | Brian A. Hurtuk | 3,969 | 40.25% | |
| Republican | Thomas Harrison | 1,058 | 10.73% | |
| Republican | Paul J. Daley | 769 | 7.80% | |
| Total votes | 9,861 | 100.00 | ||
Libertarian primary
Primary results
| Party | Candidate | Votes | % | |
|---|---|---|---|---|
| Libertarian | Ryan T. McGilvray | 99 | 100.00% | |
| Total votes | 99 | 100.00 | ||
General election
Results
| Party | Candidate | Votes | % | ||
|---|---|---|---|---|---|
| Republican | Dave Greenspan | 27,614 | 54.47% | ||
| Democratic | Nicole Dailey Jones | 20,824 | 41.08% | ||
| Libertarian | Ryan T. McGilvray | 2,258 | 4.45% | ||
| Total votes | 50,696 | 100.00 | |||
| Republican win (new seat) | |||||
District 2
Democratic primary
Primary results
| Party | Candidate | Votes | % | |
|---|---|---|---|---|
| Democratic | Dale Miller | 6,758 | 69.06% | |
| Democratic | Tom Jordan | 3,027 | 22.24% | |
| Total votes | 9,785 | 100.00 | ||
Republican primary
Primary results
| Party | Candidate | Votes | % | |
|---|---|---|---|---|
| Republican | John Zappala | 2,910 | 100.00% | |
| Total votes | 2,910 | 100.00 | ||
General election
Results
| Party | Candidate | Votes | % | ||
|---|---|---|---|---|---|
| Democratic | Dale Miller | 19,174 | 59.19% | ||
| Republican | John Zappala | 9,894 | 30.54% | ||
| Independent | Lynn Graham | 1,876 | 5.79% | ||
| Independent | Edward M. McCartney | 1,072 | 3.31% | ||
| Independent | Steve A. Bozsa Jr. | 376 | 1.16% | ||
| Total votes | 32,392 | 100.00 | |||
| Democratic win (new seat) | |||||
District 3
Democratic primary
Primary results
| Party | Candidate | Votes | % | |
|---|---|---|---|---|
| Democratic | Dan Brady | 2,777 | 46.17% | |
| Democratic | Chris Ronayne | 2,567 | 42.83% | |
| Democratic | Nelson Cintron Jr. | 375 | 6.23% | |
| Democratic | Chip Joseph | 149 | 2.48% | |
| Democratic | Faouzi A. Baddour | 138 | 2.29% | |
| Total votes | 6,015 | 100.00 | ||
Republican primary
Primary results
| Party | Candidate | Votes | % | |
|---|---|---|---|---|
| Republican | Patty Gascoyne | 1,142 | 100.00% | |
| Total votes | 1,142 | 100.00 | ||
Green primary
Primary results
| Party | Candidate | Votes | % | |
|---|---|---|---|---|
| Green | Alan Crossman | 44 | 100.00% | |
| Total votes | 44 | 100.00 | ||
General election
Results
| Party | Candidate | Votes | % | ||
|---|---|---|---|---|---|
| Democratic | Dan Brady | 12,325 | 69.01% | ||
| Republican | Patty Gascoyne | 4,158 | 23.28% | ||
| Green | Alan Crossman | 1,378 | 7.72% | ||
| Total votes | 17,861 | 100.00 | |||
| Democratic win (new seat) | |||||
District 4
Democratic primary
Primary results
| Party | Candidate | Votes | % | |
|---|---|---|---|---|
| Democratic | Chuck Germana | 7,946 | 56.99% | |
| Democratic | Barbara Anne Ferris | 4,624 | 33.16% | |
| Democratic | Matthew Bolek | 1,374 | 9.85% | |
| Total votes | 13,944 | 100.00 | ||
Republican primary
Primary results
| Party | Candidate | Votes | % | |
|---|---|---|---|---|
| Republican | Pete Draganic | 2,869 | 42.39% | |
| Republican | Arlene R. McNamara | 2,481 | 36.66% | |
| Republican | Thomas R. Olschlager | 1,418 | 20.95% | |
| Total votes | 6,768 | 100.00 | ||
General election
Results
| Party | Candidate | Votes | % | ||
|---|---|---|---|---|---|
| Democratic | Chuck Germana | 21,855 | 54.62% | ||
| Republican | Pete Draganic | 18,160 | 45.38% | ||
| Total votes | 40,465 | 100.00 | |||
| Democratic win (new seat) | |||||
District 5
Democratic primary
Primary results
| Party | Candidate | Votes | % | |
|---|---|---|---|---|
| Democratic | Ann Marie Donegan | 4,843 | 59.02% | |
| Democratic | Mike Piepsny | 3,362 | 40.98% | |
| Total votes | 8,205 | 100.00 | ||
Republican primary
Primary results
| Party | Candidate | Votes | % | |
|---|---|---|---|---|
| Republican | Michael J. Gallagher | 4,691 | 57.73% | |
| Republican | Craig A. Marvinney | 3,435 | 42.27% | |
| Total votes | 8,126 | 100.00 | ||
General election
Results
| Party | Candidate | Votes | % | ||
|---|---|---|---|---|---|
| Republican | Michael J. Gallagher | 25,245 | 59.13% | ||
| Democratic | Ann Marie Donegan | 17,449 | 40.87% | ||
| Total votes | 42,694 | 100.00 | |||
| Republican win (new seat) | |||||
District 6
Democratic primary
Primary results
| Party | Candidate | Votes | % | |
|---|---|---|---|---|
| Democratic | Frederick I. Taft | 4,224 | 48.15% | |
| Democratic | Ken Myers | 3,021 | 34.44% | |
| Democratic | Trevor K. Elkins | 1,528 | 17.42% | |
| Total votes | 8,773 | 100.00 | ||
Republican primary
Primary results
| Party | Candidate | Votes | % | |
|---|---|---|---|---|
| Republican | Jack Schron | 3,998 | 41.72% | |
| Republican | Jim Crooks | 2,670 | 27.86% | |
| Republican | Sam P. Cannata | 1,113 | 11.61% | |
| Republican | Ed Hargate | 936 | 9.77% | |
| Republican | Don Sopka | 886 | 9.04% | |
| Total votes | 9,583 | 100.00 | ||
General election
Results
| Party | Candidate | Votes | % | ||
|---|---|---|---|---|---|
| Republican | Jack Schron | 29,263 | 60.08% | ||
| Democratic | Frederick I. Taft | 19,443 | 39.92% | ||
| Total votes | 48,706 | 100.00 | |||
| Republican win (new seat) | |||||
District 7
Democratic primary
Primary results
| Party | Candidate | Votes | % | |
|---|---|---|---|---|
| Democratic | Yvonne M. Conwell | 2,215 | 35.53% | |
| Democratic | Michael Leroy Nelson Sr. | 1,385 | 22.21% | |
| Democratic | James Levin | 759 | 12.17% | |
| Democratic | Timothy J. Russo | 747 | 11.98% | |
| Democratic | Clark Broida | 527 | 8.45% | |
| Democratic | James M. D'Amico | 211 | 3.38% | |
| Democratic | Dale Alan Smith | 197 | 3.16% | |
| Democratic | Victor L. Miller | 134 | 2.15% | |
| Democratic | Timothy Trogdon | 60 | 0.96% | |
| Total votes | 6,235 | 100.00 | ||
Republican primary
Primary results
| Party | Candidate | Votes | % | |
|---|---|---|---|---|
| Republican | Phyllis Lucia Crespo | 597 | 100.00% | |
| Total votes | 597 | 100.00 | ||
General election
Results
| Party | Candidate | Votes | % | ||
|---|---|---|---|---|---|
| Democratic | Yvonne M. Conwell | 15,895 | 77.35% | ||
| Republican | Phyllis Lucia Crespo | 2,641 | 12.85% | ||
| Independent | Jeff Kipp | 1,263 | 6.15% | ||
| Independent | Olga T. Sarbinowska | 750 | 3.65% | ||
| Total votes | 20,549 | 100.00 | |||
| Democratic win (new seat) | |||||
District 8
Democratic primary
Primary results
| Party | Candidate | Votes | % | |
|---|---|---|---|---|
| Democratic | Pernel Jones Jr. | 3,202 | 37.94% | |
| Democratic | Gerald A. Cooper | 2,106 | 24.95% | |
| Democratic | Ronald Finnerty | 705 | 8.35% | |
| Democratic | John A. Boyd | 686 | 8.13% | |
| Democratic | Lacretia T. Bolden | 643 | 7.62% | |
| Democratic | Henry Warren Jr | 490 | 5.81% | |
| Democratic | Robin Poole | 391 | 4.63% | |
| Democratic | Brandon Johnson | 217 | 2.57% | |
| Total votes | 8,440 | 100.00 | ||
Republican primary
Primary results
| Party | Candidate | Votes | % | |
|---|---|---|---|---|
| Republican | Andrew G. Plavny Sr. | 965 | 100.00% | |
| Total votes | 965 | 100.00 | ||
General election
Results
| Party | Candidate | Votes | % | ||
|---|---|---|---|---|---|
| Democratic | Pernel Jones Jr. | 25,135 | 82.78% | ||
| Republican | Andrew G. Plavny Sr | 3,819 | 12.58% | ||
| Independent | Gerald Henley | 1,411 | 4.65% | ||
| Total votes | 30,365 | 100.00 | |||
| Democratic win (new seat) | |||||
District 9
Democratic primary
Primary results
| Party | Candidate | Votes | % | |
|---|---|---|---|---|
| Democratic | C. Ellen Connally | 5,620 | 46.57% | |
| Democratic | Danita Love | 1,533 | 12.70% | |
| Democratic | Kimberly F. Brown | 1,450 | 12.02% | |
| Democratic | Marcia L. McCoy | 996 | 8.25% | |
| Democratic | Patrice M. Brown | 974 | 8.07% | |
| Democratic | Donald A. Saunders | 899 | 7.45% | |
| Democratic | Sandra L. White | 386 | 3.20% | |
| Democratic | Isaac Powell | 209 | 1.73% | |
| Total votes | 12,067 | 100.00 | ||
General election
Results
| Party | Candidate | Votes | % | ||
|---|---|---|---|---|---|
| Democratic | C. Ellen Connally | 33,493 | 84.63% | ||
| Independent | James Brady | 4,604 | 11.63% | ||
| Independent | Laverne Jones Gore | 1,480 | 3.74% | ||
| Total votes | 39,577 | 100.00 | |||
| Democratic win (new seat) | |||||
District 10
Democratic primary
Primary results
| Party | Candidate | Votes | % | |
|---|---|---|---|---|
| Democratic | Julian Rogers | 2,859 | 27.77% | |
| Democratic | Sharon Cole | 2,346 | 22.78% | |
| Democratic | Alan Rapoport | 1,877 | 18.23% | |
| Democratic | Barbara J. Thomas | 1,806 | 17.54% | |
| Democratic | Danny Williams | 946 | 9.19% | |
| Democratic | KC Petraitis | 292 | 2.84% | |
| Democratic | John Crist | 171 | 1.66% | |
| Total votes | 10,297 | 100.00 | ||
Republican primary
Primary results
| Party | Candidate | Votes | % | |
|---|---|---|---|---|
| Republican | Matt Brakey | 809 | 60.37% | |
| Republican | Albert K. Oberst | 531 | 39.63% | |
| Total votes | 1,340 | 100.00 | ||
General election
Results
| Party | Candidate | Votes | % | ||
|---|---|---|---|---|---|
| Democratic | Julian Rogers | 28,175 | 84.63% | ||
| Republican | Matt Brakey | 3,972 | 12.01% | ||
| Independent | Michael Troy Watson | 922 | 2.79% | ||
| Total votes | 33,069 | 100.00 | |||
| Democratic win (new seat) | |||||
District 11
Democratic primary
Primary results
| Party | Candidate | Votes | % | |
|---|---|---|---|---|
| Democratic | Sunny M. Simon | 4,671 | 41.78% | |
| Democratic | Phil Robinson | 1,998 | 17.87% | |
| Democratic | Philip R. Fine | 1,130 | 10.11% | |
| Democratic | Patrick McLaughlin | 1,077 | 9.63% | |
| Democratic | Jim Joyner | 815 | 7.29% | |
| Democratic | Nino Prodan | 368 | 3.29% | |
| Total votes | 10,960 | 100.00 | ||
Republican primary
Primary results
| Party | Candidate | Votes | % | |
|---|---|---|---|---|
| Republican | Kathryn E. Gambatese | 2,159 | 57.25% | |
| Republican | Raymond J. Schmidlin Jr. | 696 | 18.46% | |
| Republican | Joe J. Liptow | 573 | 15.19% | |
| Republican | Gregory D. Smith | 343 | 9.10% | |
| Total votes | 3,771 | 100.00 | ||
General election
Results
| Party | Candidate | Votes | % | ||
|---|---|---|---|---|---|
| Democratic | Sunny M. Simon | 28,301 | 68.37% | ||
| Republican | Kathryn E. Gambatese | 11,408 | 27.56% | ||
| Independent | Rich Devor Jr. | 1,684 | 4.07% | ||
| Total votes | 41,393 | 100.00 | |||
| Democratic win (new seat) | |||||
References
- ↑ "November 4, 2014 General Election Official Canvass Certification Data". Cuyahoga County Board of Elections. November 25, 2014. Retrieved April 1, 2022.
- ↑ Cetina, Judith G. "Cuyahoga County Government". Case Western Reserve University. Retrieved March 31, 2022.
- ↑ Garrett, Amanda (November 3, 2010). "Three Republicans heading toward victory on Cuyahoga County Council; Dems likely to take other 8 seats". The Plain Dealer. Retrieved March 31, 2022.
- 1 2 3 4 5 6 7 8 9 10 11 12 13 14 15 16 17 18 19 20 21 22 23 "Cuyahoga County Ohio Primary Election September 7, 2010 Statistics". Cuyahoga County Board of Elections. November 17, 2010. Retrieved March 31, 2022.
- 1 2 3 4 5 6 7 8 9 10 11 "Cuyahoga County Ohio General Election November 2, 2010 Statistics". Cuyahoga County Board of Elections. August 10, 2011. Retrieved March 31, 2022.
This article is issued from Wikipedia. The text is licensed under Creative Commons - Attribution - Sharealike. Additional terms may apply for the media files.