| |||||||||||||||||||||||||
12 of the 37 seats to Crawley Borough Council 19 seats needed for a majority | |||||||||||||||||||||||||
|---|---|---|---|---|---|---|---|---|---|---|---|---|---|---|---|---|---|---|---|---|---|---|---|---|---|
| |||||||||||||||||||||||||
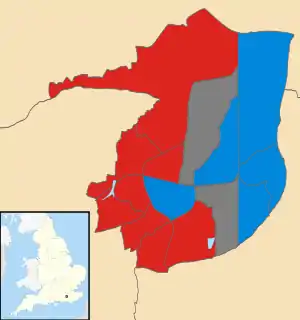 Map showing the results of the 2012 Crawley Borough Council elections by ward. Blue show Conservative seats, and red shows Labour. Wards in grey had no election. | |||||||||||||||||||||||||
| |||||||||||||||||||||||||
The 2012 Crawley Borough Council election took place on 3 May 2012 to elect members of Crawley District Council in West Sussex, England.[2][3] One third of the council was up for election. The Conservative Party retained overall control of the council.
After the election, the composition of the council was as follows:[4]
- Conservative 21
- Labour 16
Ward results
Bewbush
| Party | Candidate | Votes | % | |
|---|---|---|---|---|
| Labour | Marion Ayling | 874 | 70.9% | |
| Conservative | Susan Lester | 285 | 23.1% | |
| Justice Party | Arshad Khan | 74 | 6.0% | |
| Majority | 589 | 47.8% | ||
| Turnout | 1,233 | |||
| Labour hold | ||||
Broadfield North
| Party | Candidate | Votes | % | |
|---|---|---|---|---|
| Labour | Brian Quinn | 738 | 69.4% | |
| Conservative | Simon Darroch | 326 | 30.6% | |
| Majority | 412 | 38.8% | ||
| Turnout | 1,064 | |||
| Labour hold | ||||
Broadfield South
| Party | Candidate | Votes | % | |
|---|---|---|---|---|
| Labour | Colin Moffatt | 645 | 57.5% | |
| Conservative | Lee Gilroy | 476 | 42.5% | |
| Majority | 169 | 15.0% | ||
| Turnout | 1,121 | |||
| Labour gain from Conservative | ||||
Gossops Green
| Party | Candidate | Votes | % | |
|---|---|---|---|---|
| Labour | Chris Mullins | 731 | 47.7% | |
| Conservative | Beryl Mecrow | 658 | 42.9% | |
| BNP | Vernon Atkinson | 91 | 5.9% | |
| Liberal Democrats | Iain Dickson | 54 | 3.5% | |
| Majority | 73 | 4.8% | ||
| Turnout | 1,534 | |||
| Labour gain from Conservative | ||||
Ifield
| Party | Candidate | Votes | % | |
|---|---|---|---|---|
| Labour | Peter Smith | 983 | 49.6% | |
| Conservative | Ali Burke | 660 | 33.3% | |
| UKIP | Steven Wade | 337 | 17.0% | |
| Majority | 323 | 16.3% | ||
| Turnout | 1,980 | |||
| Labour gain from Conservative | ||||
Langley Green
| Party | Candidate | Votes | % | |
|---|---|---|---|---|
| Labour | Brenda Smith | 1,085 | 68.3% | |
| Conservative | Richard Nixon | 347 | 21.8% | |
| UKIP | Gill Andrew | 157 | 9.9% | |
| Majority | 738 | 46.5% | ||
| Turnout | 1,589 | |||
| Labour hold | ||||
Maidenbower
| Party | Candidate | Votes | % | |
|---|---|---|---|---|
| Conservative | Duncan Peck | 1,074 | 71.6% | |
| Labour | Andrew Skudder | 425 | 28.4% | |
| Majority | 649 | 43.2% | ||
| Turnout | 1,499 | |||
| Conservative hold | ||||
Pound Hill North
| Party | Candidate | Votes | % | |
|---|---|---|---|---|
| Conservative | Keith Brockwell | 880 | 62.5% | |
| Labour | Kultar Jogi | 307 | 21.8% | |
| Liberal Democrats | John Mac Canna | 140 | 10.0% | |
| UKIP | Richard Symonds | 80 | 5.7% | |
| Majority | 573 | 40.7% | ||
| Turnout | 1,407 | |||
| Conservative hold | ||||
Pound Hill South and Worth
| Party | Candidate | Votes | % | |
|---|---|---|---|---|
| Conservative | Bob Lanzer | 1,224 | 71.0% | |
| Labour | Sina Adeniyi | 499 | 29.0% | |
| Majority | 725 | 42.0% | ||
| Turnout | 1,723 | |||
| Conservative hold | ||||
Southgate
| Party | Candidate | Votes | % | |
|---|---|---|---|---|
| Conservative | Liam Marshall-Ascough | 920 | 44.5% | |
| Labour | Raj Sharma | 854 | 41.3% | |
| Liberal Democrats | Malcolm Liles | 294 | 14.2% | |
| Majority | 66 | 3.2% | ||
| Turnout | 2,068 | |||
| Conservative hold | ||||
Three Bridges
| Party | Candidate | Votes | % | |
|---|---|---|---|---|
| Conservative | Brenda Burgess | 875 | 54.6% | |
| Labour | Samantha Bateman | 728 | 45.4% | |
| Majority | 147 | 9.2% | ||
| Turnout | 1,603 | |||
| Conservative hold | ||||
Tilgate
| Party | Candidate | Votes | % | |
|---|---|---|---|---|
| Labour | Colin Lloyd | 878 | 59.4% | |
| Conservative | George O'Keefe | 482 | 32.6% | |
| Green | Derek Hardman | 119 | 8.0% | |
| Majority | 396 | 26.8% | ||
| Turnout | 1,479 | |||
| Labour hold | ||||
- Note: This Tilgate seat was won by the Conservatives at the previous regular election in 2008, but gained by Labour in a by-election in 2010[5]
West Green
| Party | Candidate | Votes | % | |
|---|---|---|---|---|
| Labour | Bill Ward | 658 | 67.3% | |
| Conservative | Chrissie Brown | 320 | 32.7% | |
| Majority | 338 | 34.6% | ||
| Turnout | 978 | |||
| Labour hold | ||||
References
- 1 2 3 4 5 6 7 8 9 10 11 12 13 14 Andrew Teale. "Local Election Results 2012". Local Elections Archive Project.
- ↑ "Local Elections May 2012". uklocalgov. Retrieved 15 November 2011.
- ↑ "Vote 2012". conservativecouncillors. Retrieved 15 November 2011.
- ↑ "England council elections". BBC News Online. 4 May 2012. Retrieved 16 June 2019.
- ↑ "Local Authority Byelection Results". Retrieved 17 June 2019.
| West Sussex CC | |
|---|---|
| Adur | |
| Arun | |
| Chichester | |
| Crawley | |
| Horsham | |
| Mid Sussex | |
| Worthing | |
| |
This article is issued from Wikipedia. The text is licensed under Creative Commons - Attribution - Sharealike. Additional terms may apply for the media files.