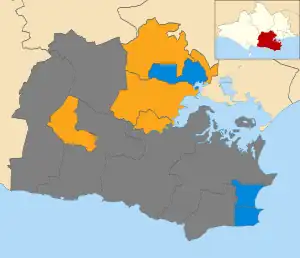
Map of the results of the 2012 Purbeck District Council election. Conservatives in blue and Liberal Democrats in yellow. Wards in grey were not contested.
The 2012 Purbeck District Council election to the Purbeck District Council in Dorset took place on Thursday 3 May 2012.
Election result
| Party | Seats | Gains | Losses | Net gain/loss | Seats % | Votes % | Votes | +/− | |
|---|---|---|---|---|---|---|---|---|---|
| Conservative | |||||||||
| Labour | |||||||||
| Liberal Democrats | |||||||||
Ward results
| Party | Candidate | Votes | % | ±% | |
|---|---|---|---|---|---|
| Liberal Democrats | John Taylor | 623 | |||
| Conservative | Ian Maitland | 588 | |||
| Rejected ballots | 9 | ||||
| Majority | 35 | ||||
| Turnout | 1,220 | 40.49 | |||
| Liberal Democrats hold | Swing | ||||
| Party | Candidate | Votes | % | ±% | |
|---|---|---|---|---|---|
| Liberal Democrats | Carol Tilling | 528 | |||
| Conservative | Clair Pipe | 384 | |||
| Rejected ballots | 19 | ||||
| Majority | 144 | ||||
| Turnout | 931 | 29.62 | |||
| Liberal Democrats hold | Swing | ||||
| Party | Candidate | Votes | % | ±% | |
|---|---|---|---|---|---|
| Conservative | Paul Johns | 618 | |||
| Liberal Democrats | Andrew Starr | 455 | |||
| Rejected ballots | 15 | ||||
| Majority | 163 | ||||
| Turnout | 1,088 | 35.98 | |||
| Conservative hold | Swing | ||||
| Party | Candidate | Votes | % | ±% | |
|---|---|---|---|---|---|
| Liberal Democrats | Beryl Ezzard | 511 | |||
| Conservative | Dean Hutton | 265 | |||
| Rejected ballots | 13 | ||||
| Majority | 246 | ||||
| Turnout | 789 | 36.41 | |||
| Liberal Democrats hold | Swing | ||||
| Party | Candidate | Votes | % | ±% | |
|---|---|---|---|---|---|
| Conservative | Gloria Marsh | 778 | |||
| Liberal Democrats | Peter Clark | 273 | |||
| Labour | Lorie Harding | 231 | |||
| Rejected ballots | 11 | ||||
| Majority | 505 | ||||
| Turnout | 1,293 | 38.79 | |||
| Conservative hold | Swing | ||||
| Party | Candidate | Votes | % | ±% | |
|---|---|---|---|---|---|
| Conservative | Alison Patrick | 784 | |||
| Labour Co-op | Rupert Roker | 570 | |||
| Liberal Democrats | Mike Hadley | 250 | |||
| Rejected ballots | 13 | ||||
| Majority | 214 | ||||
| Turnout | 1,618 | 34.08 | |||
| Conservative hold | Swing | ||||
| Party | Candidate | Votes | % | ±% | |
|---|---|---|---|---|---|
| Liberal Democrats | Keith Critchley | 954 | |||
| Conservative | Mike Wiggins | 719 | |||
| Rejected ballots | 29 | ||||
| Majority | 235 | ||||
| Turnout | 1,703 | 37.43 | |||
| Liberal Democrats hold | Swing | ||||
| Party | Candidate | Votes | % | ±% | |
|---|---|---|---|---|---|
| Liberal Democrats | Graham Holmes | 596 | |||
| Conservative | Richard Ley | 366 | |||
| Labour | Tom Holmes | 142 | |||
| Rejected ballots | 13 | ||||
| Majority | 230 | ||||
| Turnout | 1,117 | 29.80 | |||
| Liberal Democrats hold | Swing | ||||
References
- ↑ "Purbeck District Council election results". Retrieved 4 January 2013.
This article is issued from Wikipedia. The text is licensed under Creative Commons - Attribution - Sharealike. Additional terms may apply for the media files.