| |||||||||||||||||||||
12 of 35 seats to Hyndburn Borough Council 18 seats needed for a majority | |||||||||||||||||||||
|---|---|---|---|---|---|---|---|---|---|---|---|---|---|---|---|---|---|---|---|---|---|
| |||||||||||||||||||||
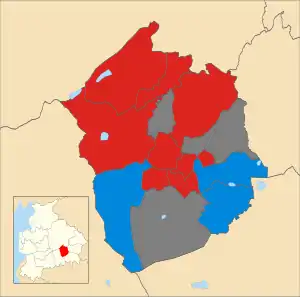 | |||||||||||||||||||||
Elections to Hyndburn Borough Councill were held on Thursday, 3 May 2012. One third of the council was up for election.
Background
Before the election Labour had a single-seat majority of 18 councillors, Conservatives had 14 councillors, while Independent (politician) had 3 councillors.
Labour candidates contested every ward. Conservative candidates contested all wards except Peel-Ward. 'Various' Independent candidates contested five-wards. LibDem's just three-candidates contested in Barnfield-ward, Church-ward & Spring Hill-ward. Ukip's only-two candidates contested in Overton-ward & St. Oswalds-ward.
Local Election result
After the election, the composition of the council was -
- Labour 23
- Conservative 9
- Independent 3
| Party | Seats | Gains | Losses | Net gain/loss | Seats % | Votes % | Votes | +/− | |
|---|---|---|---|---|---|---|---|---|---|
| Labour | 9 | 5 | 0 | 5 | 65.7 | 55.91 | 9351 | 2240 | |
| Conservative | 3 | 0 | 5 | -5 | 25.7 | 35.19 | 5885 | -2593 | |
| Independents in Hyndburn | 0 | 0 | 0 | 0 | 8.6 | 3.82 | 639 | 242 | |
| UKIP | 0 | 0 | 0 | 0 | 0 | 3.77 | 630 | N/A | |
| Liberal Democrats | 0 | 0 | 0 | 0 | 0 | 1.32 | 220 | -597 | |
NB: Four (of the 16) Council ward seats that were NOT up for re-election in 2012 included the following wards - Clayton Le Moors, Huncoat, Immanuel in Oswaldtwistle and Milnshaw in Accrington.
Ward results
Altham
| Party | Candidate | Votes | % | ±% | |
|---|---|---|---|---|---|
| Labour | Chris FISHER | 733 | 62.12 | 14.52 | |
| Conservative | Marion RAYNOR | 251 | 21.27 | -31.13 | |
| Independents in Hyndburn | John HODGKISS | 196 | 16.61 | N/A | |
| Majority | 482 | 40.85 | N/A | ||
| Turnout | 1,180 | TBC | |||
| Labour gain from Conservative | Swing | ||||
Barnfield
| Party | Candidate | Votes | % | ±% | |
|---|---|---|---|---|---|
| Conservative | Tony DOBSON | 770 | 54.88 | -10.02 | |
| Labour | Joyce PLUMMER | 609 | 43.41 | 22.71 | |
| Liberal Democrats | Richard KELLY | 24 | 1.71 | N/A | |
| Majority | 161 | 11.48 | N/A | ||
| Turnout | 1,403 | TBC | |||
| Conservative hold | Swing | ||||
Baxenden
| Party | Candidate | Votes | % | ±% | |
|---|---|---|---|---|---|
| Conservative | Terry HURN | 726 | 64.42 | -6.58 | |
| Labour | David HARTLEY | 401 | 35.58 | 16.98 | |
| Majority | 325 | 28.84 | N/A | ||
| Turnout | 1,127 | TBC | |||
| Conservative hold | Swing | ||||
Central
| Party | Candidate | Votes | % | ±% | |
|---|---|---|---|---|---|
| Labour | Abdul KHAN | 1163 | 57.83 | 26.63 | |
| Conservative | Allah DAD | 848 | 42.17 | 0.27 | |
| Majority | 213 | 15.66 | N/A | ||
| Turnout | 2,011 | TBC | |||
| Labour gain from Conservative | Swing | ||||
Church
| Party | Candidate | Votes | % | ±% | |
|---|---|---|---|---|---|
| Labour | Joan SMITH | 710 | 58.58 | 1.28 | |
| Conservative | Basharat KHAN | 325 | 26.82 | -15.88 | |
| Independent | Malcolm PRITCHARD | 141 | 11.63 | N/A | |
| Liberal Democrats | Stephen TALBOT | 36 | 2.97 | N/A | |
| Majority | 385 | 31.77 | N/A | ||
| Turnout | 1,212 | TBC | |||
| Labour hold | Swing | ||||
Netherton
| Party | Candidate | Votes | % | ±% | |
|---|---|---|---|---|---|
| Labour | Noordad AZIZ | 834 | 65.26 | 32.56 | |
| Conservative | Lynn WILSON | 444 | 34.74 | -2.26 | |
| Majority | 390 | 30.52 | N/A | ||
| Turnout | 1,278 | TBC | |||
| Labour gain from Conservative | Swing | ||||
Overton
| Party | Candidate | Votes | % | ±% | |
|---|---|---|---|---|---|
| Labour | Kerry MOLINEUX | 868 | 45.80 | 1.3 | |
| Conservative | Peter CLARKE | 387 | 20.42 | -35.08 | |
| Independent | John DUCKWORTH | 317 | 16.73 | N/A | |
| UKIP | Graham DAVIDSON | 224 | 11.82 | N/A | |
| Great Harwood Independents | Jamie GLOVER | 99 | 5.22 | N/A | |
| Majority | 481 | 25.38 | N/A | ||
| Turnout | 1,895 | TBC | |||
| Labour gain from Conservative | Swing | ||||
Peel
| Party | Candidate | Votes | % | ±% | |
|---|---|---|---|---|---|
| Labour | Wendy DWYER | 570 | 67.70 | -4.0 | |
| Independents in Hyndburn | Paul BROWN | 272 | 32.30 | N/A | |
| Majority | 298 | 35.39 | N/A | ||
| Turnout | 842 | TBC | |||
| Labour hold | Swing | ||||
Rishton
| Party | Candidate | Votes | % | ±% | |
|---|---|---|---|---|---|
| Labour | Harry GRAYSON | 1374 | 71.30 | 8.5 | |
| Conservative | Warren MELIA | 553 | 28.70 | -8.5 | |
| Majority | 821 | 42.61 | N/A | ||
| Turnout | 1,927 | TBC | |||
| Labour hold | Swing | ||||
Spring Hill
| Party | Candidate | Votes | % | ±% | |
|---|---|---|---|---|---|
| Labour | Munsif DAD | 940 | 60.22 | 2.32 | |
| Conservative | Mohammed YOUNIS | 400 | 25.62 | -16.48 | |
| Independents in Hyndburn | Kenneth SMITH | 171 | 10.95 | N/A | |
| Liberal Democrats | Kim FURNESS | 50 | 3.20 | N/A | |
| Majority | 540 | 34.59 | N/A | ||
| Turnout | 1,561 | TBC | |||
| Labour hold | Swing | ||||
St. Andrew's
| Party | Candidate | Votes | % | ±% | |
|---|---|---|---|---|---|
| Labour | Bill PINDER | 543 | 52.62 | 25.12 | |
| Conservative | Brian WALMSLEY | 489 | 47.38 | -12.02 | |
| Majority | 53 | 5.14 | N/A | ||
| Turnout | 1,032 | TBC | |||
| Labour gain from Conservative | Swing | ||||
St. Oswald's
| Party | Candidate | Votes | % | ±% | |
|---|---|---|---|---|---|
| Conservative | Marlene HAWORTH | 692 | 40.61 | -25.59 | |
| Labour | Stewart EAVES | 606 | 35.56 | 1.76 | |
| UKIP | Paul THOMPSON | 406 | 23.83 | N/A | |
| Majority | 86 | 5.05 | N/A | ||
| Turnout | 1,704 | TBC | |||
| Conservative hold | Swing | ||||
References
- ↑ "Hyndburn Borough Council Local Elections 2012 - Results". Hyndburn Borough Council. Retrieved 5 May 2012.
https://www.bbc.co.uk/news/special/vote2012/council/E07000120.stm