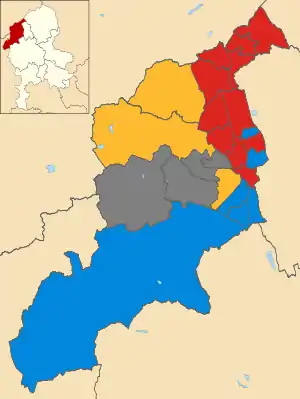
Map of the results of the 2012 Newcastle-under-Lyme council election. Labour in red, Conservatives in blue and Liberal Democrats in yellow. Wards in grey were not contested in 2012.
The 2012 Newcastle-under-Lyme Borough Council election took place on 3 May 2012 to elect members of Newcastle-under-Lyme Council in England.[1] This was on the same day as other 2012 United Kingdom local elections.
Election result
| Party | Seats | Gains | Losses | Net gain/loss | Seats % | Votes % | Votes | +/− | |
|---|---|---|---|---|---|---|---|---|---|
| Labour | 11 | 10 | 0 | +10 | |||||
| Conservative | 6 | 0 | 5 | -5 | |||||
| Liberal Democrats | 3 | 0 | 3 | -3 | |||||
| UKIP | 0 | 0 | 2 | -2 | 0 | ||||
| Independent | 0 | 0 | 0 | 0 | 0 | ||||
| TUSC | 0 | 0 | 0 | 0 | 0 | ||||
| 0 | 0 | 0 | 0 | 0 | |||||
| TOTAL | 20 | 8 | 8 | 0 | 100% | ||||
Ward results
Spoilt votes not included below.
Audley & Bignall End ward
| Party | Candidate | Votes | % | ±% | |
|---|---|---|---|---|---|
| Liberal Democrats | Ian Wilkes | 712 | 47.5 | −3.8 | |
| Labour | Philip Morgan | 609 | 40.6 | +18.1 | |
| Conservative | Simon Barnes | 179 | 11.9 | −5.3 | |
| Majority | 103 | 6.9 | |||
| Turnout | 1,500 | ||||
| Liberal Democrats hold | Swing | ||||
Bradwell ward
| Party | Candidate | Votes | % | ±% | |
|---|---|---|---|---|---|
| Labour | Glyn Plant | 972 | 67.8 | +38.5 | |
| Conservative | John Tagg | 391 | 27.3 | −10.3 | |
| Liberal Democrats | Julian Colclough | 70 | 4.9 | −3.3 | |
| Majority | 581 | 40.5 | |||
| Turnout | 1,433 | ||||
| Labour gain from Conservative | Swing | ||||
Butt Lane ward
| Party | Candidate | Votes | % | ±% | |
|---|---|---|---|---|---|
| Labour | Silvia Burgess | 676 | 60.5 | +31.8 | |
| Liberal Democrats | Dennis Richards | 313 | 28.0 | −8.4 | |
| Conservative | Daniel Jellyman | 128 | 11.5 | −9.1 | |
| Majority | 363 | 32.5 | |||
| Turnout | 1,117 | ||||
| Labour gain from Conservative | Swing | ||||
Chesterton ward
| Party | Candidate | Votes | % | ±% | |
|---|---|---|---|---|---|
| Labour | Hilda Johnson | 804 | 68.7 | +36.6 | |
| Conservative | Rita Gilmore | 219 | 18.7 | −3.0 | |
| Liberal Democrats | Mike Dolman | 147 | 12.6 | −10.8 | |
| Majority | 585 | 50.0 | |||
| Turnout | 1,170 | ||||
| Labour hold | Swing | ||||
Clayton ward
| Party | Candidate | Votes | % | ±% | |
|---|---|---|---|---|---|
| Conservative | Ann Heames | 514 | 49.3 | −3.1 | |
| Labour | Rob Wallace | 431 | 35.7 | +19.2 | |
| Liberal Democrats | Mavis Brown | 97 | 9.3 | −11.7 | |
| Majority | 83 | 13.6 | |||
| Turnout | 1,042 | ||||
| Conservative hold | Swing | ||||
Cross Heath ward
| Party | Candidate | Votes | % | ±% | |
|---|---|---|---|---|---|
| Labour | Joan Winfield | 739 | 57.1 | +21.2 | |
| UKIP | Nathan Jones | 381 | 29.4 | −7.7 | |
| Conservative | Andrew Firth | 117 | 9.0 | −8.1 | |
| Liberal Democrats | David Dugdale | 58 | 4.5 | −5.3 | |
| Majority | 358 | 27.7 | |||
| Turnout | 1,295 | ||||
| Labour gain from UKIP | Swing | ||||
Halmer End ward
| Party | Candidate | Votes | % | ±% | |
|---|---|---|---|---|---|
| Liberal Democrats | Andrew Wemyss | 482 | 45.8 | −2.8 | |
| Labour | Paul Breuer | 408 | 38.7 | +20.5 | |
| Conservative | Adam Carney | 163 | 15.5 | −5.0 | |
| Majority | 74 | 7.1 | |||
| Turnout | 1,053 | ||||
| Liberal Democrats hold | Swing | ||||
Holditch ward
| Party | Candidate | Votes | % | ±% | |
|---|---|---|---|---|---|
| Labour | Sophia Baker | 458 | 64.1 | +26.5 | |
| UKIP | Eileen Braithwaite | 193 | 27.0 | −12.5 | |
| Liberal Democrats | Dennis Cornes | 34 | 4.8 | −5.6 | |
| Conservative | Alex Chadwick | 30 | 4.2 | −8.4 | |
| Majority | 265 | 37.1 | |||
| Turnout | 715 | ||||
| Labour gain from UKIP | Swing | ||||
Kidsgrove ward
| Party | Candidate | Votes | % | ±% | |
|---|---|---|---|---|---|
| Labour | Reginald Bailey | 802 | 66.3 | +32.5 | |
| Conservative | James Vernon | 153 | 12.6 | −2.7 | |
| Liberal Democrats | Lynda Griffiths | 146 | 12.1 | −33.5 | |
| TUSC | Claire Vodrey | 109 | 9.0 | New | |
| Majority | 649 | 53.7 | |||
| Turnout | 1,210 | ||||
| Labour gain from Liberal Democrats | Swing | ||||
Loggerheads & Whitmore ward
| Party | Candidate | Votes | % | ±% | |
|---|---|---|---|---|---|
| Conservative | Tracey Peers | N/A | N/A | N/A | |
| Conservative hold | Swing | ||||
May Bank ward
| Party | Candidate | Votes | % | ±% | |
|---|---|---|---|---|---|
| Conservative | Ian Matthews | 869 | 51.1 | −11.2 | |
| Labour | Stephen Harrison | 538 | 31.6 | +14.7 | |
| UKIP | Carol Lovatt | 210 | 12.3 | +4.9 | |
| Liberal Democrats | Michael Birkett | 84 | 4.9 | −8.5 | |
| Majority | 331 | 19.5 | |||
| Turnout | 1,701 | ||||
| Conservative hold | Swing | ||||
Newchapel ward
| Party | Candidate | Votes | % | ±% | |
|---|---|---|---|---|---|
| Labour | Elsie Bates | 386 | 53.1 | +22.8 | |
| Conservative | Pamela Jellyman | 248 | 34.1 | −10.0 | |
| Liberal Democrats | Alan Brookes | 54 | 7.4 | −11.7 | |
| Independent | Michael Prosser | 39 | 5.4 | N/A | |
| Majority | 138 | 19.0 | |||
| Turnout | 727 | ||||
| Labour gain from Conservative | Swing | ||||
Porthill ward
| Party | Candidate | Votes | % | ±% | |
|---|---|---|---|---|---|
| Conservative | John Cooper | 422 | 43.0 | −21.7 | |
| Labour | Steff Featherstone | 373 | 38.0 | +14.0 | |
| UKIP | Derrick Huckfield | 152 | 15.5 | N/A | |
| Liberal Democrats | Eric Durber | 34 | 3.5 | −7.8 | |
| Majority | 49 | 5.0 | |||
| Turnout | 981 | ||||
| Conservative hold | Swing | ||||
Ravenscliffe ward
| Party | Candidate | Votes | % | ±% | |
|---|---|---|---|---|---|
| Labour | David Stringer | 446 | 50.2 | +27.8 | |
| UKIP | Geoffrey Locke | 252 | 28.3 | +9.5 | |
| Conservative | Stephen Blair | 191 | 21.5 | −18.4 | |
| Majority | 194 | 21.9 | |||
| Turnout | 889 | ||||
| Labour gain from Conservative | Swing | ||||
Seabridge ward
| Party | Candidate | Votes | % | ±% | |
|---|---|---|---|---|---|
| Conservative | Chloe Mancey | 668 | 54.2 | +5.6 | |
| Labour | Danny Walker | 450 | 36.5 | +16.5 | |
| Liberal Democrats | Hilary Jones | 114 | 9.3 | −5.3 | |
| Majority | 218 | 17.7 | |||
| Turnout | 1,232 | ||||
| Conservative hold | Swing | ||||
Talke ward
| Party | Candidate | Votes | % | ±% | |
|---|---|---|---|---|---|
| Labour | Mike Stubbs | 460 | 53.8 | +39.0 | |
| Liberal Democrats | Janet Parsons | 267 | 31.2 | −22.6 | |
| Conservative | Nicola Ralphs | 128 | 15.0 | −2.2 | |
| Majority | 193 | 22.6 | |||
| Turnout | 855 | ||||
| Labour gain from Liberal Democrats | Swing | ||||
Thistleberry ward
| Party | Candidate | Votes | % | ±% | |
|---|---|---|---|---|---|
| Liberal Democrats | Marion Reddish | 757 | 44.0 | −5.7 | |
| Labour | Jim Matthews | 366 | 21.3 | +8.7 | |
| Conservative | Jonathan Fernyhough | 291 | 16.9 | −12.8 | |
| Independent | Angela Drakakis-Smith | 153 | 8.9 | N/A | |
| UKIP | Maria Foy | 152 | 8.8 | +0.9 | |
| Majority | 391 | 22.7 | |||
| Turnout | 1,719 | ||||
| Liberal Democrats hold | Swing | ||||
Town ward
| Party | Candidate | Votes | % | ±% | |
|---|---|---|---|---|---|
| Labour | Matt Taylor | 465 | 49.1 | +22.8 | |
| Liberal Democrats | Michael Shenton | 258 | 27.2 | −20.1 | |
| Conservative | Ian Gilmore | 137 | 14.5 | −5.0 | |
| UKIP | Wayne Harling | 88 | 9.3 | +2.3 | |
| Majority | 207 | 21.9 | |||
| Turnout | 948 | ||||
| Labour gain from Liberal Democrats | Swing | ||||
Westlands ward
| Party | Candidate | Votes | % | ±% | |
|---|---|---|---|---|---|
| Conservative | Linda Hailstones | 962 | 60.0 | −6.2 | |
| Labour | Steve Bainbridge | 471 | 29.4 | +17.9 | |
| Liberal Democrats | Carol Reddish | 169 | 10.5 | −5.1 | |
| Majority | 491 | 30.6 | |||
| Turnout | 1,602 | ||||
| Conservative hold | Swing | ||||
Wolstanton ward
| Party | Candidate | Votes | % | ±% | |
|---|---|---|---|---|---|
| Labour | Colin Eastwood | 566 | 40.9 | +16.5 | |
| Conservative | John Pedder | 359 | 26.0 | −4.0 | |
| UKIP | David Woolley | 284 | 20.5 | −9.0 | |
| Liberal Democrats | Mark Hammersley | 131 | 9.5 | −1.3 | |
| TUSC | Richard Steele | 43 | 3.1 | New | |
| Majority | 207 | 14.9 | N/A | ||
| Turnout | 1,383 | ||||
| Labour gain from Conservative | Swing | ||||
References
- ↑ "Local elections 2012". BBC News. Retrieved 30 April 2012.
This article is issued from Wikipedia. The text is licensed under Creative Commons - Attribution - Sharealike. Additional terms may apply for the media files.