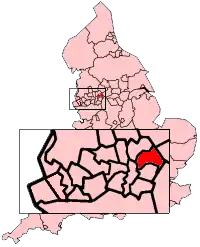
The Metropolitan Borough of Oldham shown within England.
The 2014 Oldham Metropolitan Borough Council election took place on 22 May 2014 to elect members of Oldham Metropolitan Borough Council in England.[1] This was on the same day as other local elections.
Labour retained control of the Council.
After the election, the composition of the council was
- Labour 45
- Liberal Democrat 10
- Conservative 2
- UKIP 2
- Independent 1
Election result
| Party | Seats | Gains | Losses | Net gain/loss | Seats % | Votes % | Votes | +/− | |
|---|---|---|---|---|---|---|---|---|---|
| Labour | 15 | 2 | 1 | +1 | 45.4 | 25,760 | -9.5 | ||
| UKIP | 2 | 2 | 0 | +2 | 23.7 | 13,457 | +22.3 | ||
| Liberal Democrats | 3 | 0 | 4 | -4 | 13.0 | 7,402 | -11.6 | ||
| Conservative | 0 | 0 | 0 | +0 | 12.5 | 7,132 | -2.3 | ||
| Independent | 1 | 1 | 0 | +1 | 3.6 | 2,049 | -1.3 | ||
| Green | 0 | 0 | 0 | 1.8 | 1,015 | +1.5 | |||
| TUSC | 0 | 0 | 0 | 0.1 | 59 | +0.1 | |||
Ward results
Alexandra ward
| Party | Candidate | Votes | % | ±% | |
|---|---|---|---|---|---|
| Labour | Shaid Mushtaq | 1,384 | 48.9 | +2.5 | |
| UKIP | David Carter | 672 | 23.7 | +23.7 | |
| Liberal Democrats | Mohammed Masud | 582 | 20.6 | +1.8 | |
| Conservative | Terry Hopkinson | 112 | 4.0 | -30.8 | |
| Independent | Rebecca McGladdery | 81 | 2.9 | +2.9 | |
| Majority | 712 | 25.1 | +13.7 | ||
| Turnout | 2,831 | ||||
| Labour hold | Swing | ||||
Chadderton Central ward
| Party | Candidate | Votes | % | ±% | |
|---|---|---|---|---|---|
| Labour | Colin McLaren | 1,287 | 45.1 | -23.3 | |
| UKIP | Vivien Swift | 946 | 33.1 | +33.1 | |
| Conservative | Robert Barnes | 540 | 18.9 | -7.4 | |
| Liberal Democrats | Louie Hamblett | 81 | 2.8 | -2.5 | |
| Majority | 341 | 11.9 | -30.3 | ||
| Turnout | 2,854 | ||||
| Labour hold | Swing | ||||
Chadderton North ward
| Party | Candidate | Votes | % | ±% | |
|---|---|---|---|---|---|
| Labour | Barbara Brownridge | 1,420 | 49.7 | -9.8 | |
| UKIP | John Berry | 785 | 27.5 | +27.5 | |
| Conservative | Paul Martin | 579 | 20.3 | -15.1 | |
| Liberal Democrats | Keith Taylor | 75 | 2.6 | -2.5 | |
| Majority | 635 | 22.2 | -1.9 | ||
| Turnout | 2,859 | ||||
| Labour hold | Swing | ||||
Chadderton South ward
| Party | Candidate | Votes | % | ±% | |
|---|---|---|---|---|---|
| Labour | Joy Wrigglesworth | 960 | 40.5 | -34.9 | |
| UKIP | Steve Connor | 948 | 40.0 | +40.0 | |
| Conservative | Eileen Hulme | 287 | 12.1 | -9.9 | |
| Green | Melody Walker | 134 | 5.7 | +3.2 | |
| Liberal Democrats | Kevin Dawson | 39 | 1.6 | +1.6 | |
| Majority | 12 | 0.5 | -52.9 | ||
| Turnout | 2,368 | ||||
| Labour hold | Swing | ||||
Coldhurst ward
| Party | Candidate | Votes | % | ±% | |
|---|---|---|---|---|---|
| Labour | Abdul Malik | 2,781 | 77.8 | +19.2 | |
| Conservative | Sean Curley | 279 | 7.8 | +2.9 | |
| Liberal Democrats | Keith Pendlebury | 273 | 7.6 | -28.9 | |
| Independent | Md Miah | 242 | 6.8 | +6.8 | |
| Majority | 2,502 | 70.0 | +47.9 | ||
| Turnout | 3,575 | ||||
| Labour hold | Swing | ||||
Crompton ward
| Party | Candidate | Votes | % | ±% | |
|---|---|---|---|---|---|
| Liberal Democrats | Dave Murphy | 889 | 30.7 | -15.0 | |
| UKIP | Derek Fletcher | 742 | 25.6 | +25.6 | |
| Labour | Ken Rustidge | 697 | 24.1 | -9.6 | |
| Conservative | Phelyp Bennett | 490 | 16.9 | -3.6 | |
| Green | Catherine Hunter | 77 | 2.7 | +2.7 | |
| Majority | 147 | 5.1 | -6.9 | ||
| Turnout | 2,895 | ||||
| Liberal Democrats hold | Swing | ||||
Failsworth East ward
| Party | Candidate | Votes | % | ±% | |
|---|---|---|---|---|---|
| Labour | Norman Briggs | 1,055 | 47.1 | -37.8 | |
| UKIP | Joan Spencer | 785 | 35.0 | +35.0 | |
| Conservative | Adam Carney | 284 | 12.7 | +12.7 | |
| Green | Andrew Rossall | 93 | 4.1 | +4.1 | |
| Liberal Democrats | Bill Cullen | 24 | 1.1 | -14.0 | |
| Majority | 270 | 12.0 | -57.7 | ||
| Turnout | 2,241 | ||||
| Labour hold | Swing | ||||
Failsworth West ward
| Party | Candidate | Votes | % | ±% | |
|---|---|---|---|---|---|
| UKIP | Warren Bates | 1,120 | 44.0 | +10.7 | |
| Labour | John Battye | 988 | 38.8 | -22.1 | |
| Conservative | Steven Cox | 225 | 8.8 | +8.8 | |
| Green | Jean Betteridge | 126 | 4.9 | +4.9 | |
| TUSC | Sam Pennington | 59 | 2.3 | +2.3 | |
| Liberal Democrats | Enid Firth | 29 | 1.1 | -4.8 | |
| Majority | 132 | 5.2 | |||
| Turnout | 2,547 | ||||
| UKIP gain from Labour | Swing | ||||
Hollinwood ward
| Party | Candidate | Votes | % | ±% | |
|---|---|---|---|---|---|
| Labour | Jean Stretton | 1,094 | 50.1 | -17.3 | |
| UKIP | Thomas Eddleston | 813 | 37.2 | +37.2 | |
| Conservative | David Caddick | 155 | 7.1 | -1.2 | |
| Liberal Democrats | Martin Dinoff | 122 | 5.6 | -18.7 | |
| Majority | 281 | 12.9 | -30.3 | ||
| Turnout | 2,184 | ||||
| Labour hold | Swing | ||||
Medlock Vale ward
| Party | Candidate | Votes | % | ±% | |
|---|---|---|---|---|---|
| Labour | Yasmin Toor | 1,511 | 47.1 | -17.7 | |
| UKIP | Jean Eddleston | 836 | 26.1 | +26.1 | |
| Conservative | Mohammed Zulfiqar | 748 | 23.3 | +18.3 | |
| Liberal Democrats | John Hall | 113 | 3.5 | -13.1 | |
| Majority | 675 | 29.2 | -18.9 | ||
| Turnout | 2,308 | ||||
| Labour hold | Swing | ||||
Royton North ward
| Party | Candidate | Votes | % | ±% | |
|---|---|---|---|---|---|
| Labour | Hannah Roberts | 1,147 | 42.2 | -29.2 | |
| UKIP | Kevin Allen | 979 | 36.0 | +36.0 | |
| Conservative | Lewis Quigg | 542 | 19.9 | -3.3 | |
| Liberal Democrats | Shaun Duffy | 51 | 1.9 | -3.5 | |
| Majority | 168 | 6.2 | -42.0 | ||
| Turnout | 2,719 | ||||
| Labour hold | Swing | ||||
Royton South ward
| Party | Candidate | Votes | % | ±% | |
|---|---|---|---|---|---|
| Labour | Marie Bashforth | 1,205 | 46.8 | -23.0 | |
| UKIP | Jackie Garnett | 770 | 29.9 | +29.9 | |
| Conservative | Allan Fish | 417 | 16.2 | -8.0 | |
| Green | Jim Stidworthy | 103 | 4.0 | +4.0 | |
| Liberal Democrats | Angie Farrell | 80 | 3.1 | -2.9 | |
| Majority | 435 | 16.9 | -28.2 | ||
| Turnout | 2,575 | ||||
| Labour hold | Swing | ||||
Saddleworth North ward
| Party | Candidate | Votes | % | ±% | |
|---|---|---|---|---|---|
| Independent | Nicola Kirkham | 1,147 | 36.5 | +5.5 | |
| Liberal Democrats | Alan Roughley | 669 | 21.3 | -11.8 | |
| UKIP | Angela Clark | 526 | 16.7 | +16.7 | |
| Labour | Paul Fryer | 430 | 13.7 | -2.7 | |
| Conservative | Nicola Sykes | 370 | 11.8 | -7.9 | |
| Majority | 478 | 15.2 | |||
| Turnout | 3,142 | ||||
| Independent gain from Liberal Democrats | Swing | ||||
Saddleworth South ward
| Party | Candidate | Votes | % | ±% | |
|---|---|---|---|---|---|
| Liberal Democrats | John McCann | 967 | 28.6 | -4.7 | |
| Conservative | Pam Byrne | 816 | 24.1 | -16.3 | |
| Independent | Lesley Brown | 579 | 17.1 | +17.1 | |
| Labour | Ian Manners | 517 | 15.3 | -10.9 | |
| UKIP | Chris Shyne | 506 | 14.9 | +14.9 | |
| Majority | 151 | 4.5 | |||
| Turnout | 3,385 | ||||
| Liberal Democrats hold | Swing | ||||
Saddleworth West & Lees ward
| Party | Candidate | Votes | % | ±% | |
|---|---|---|---|---|---|
| UKIP | Peter Klonowski | 917 | 31.0 | +31.0 | |
| Liberal Democrats | Robert Allsopp' | 778 | 26.3 | -21.1 | |
| Labour | Stephen Hewitt | 733 | 24.8 | -14.1 | |
| Conservative | Neil Allsopp | 383 | 12.9 | -0.8 | |
| Green | Oliver Thompson | 147 | 5.0 | +5.0 | |
| Majority | 139 | 4.7 | |||
| Turnout | 2,958 | ||||
| UKIP gain from Liberal Democrats | Swing | ||||
Shaw ward
| Party | Candidate | Votes | % | ±% | |
|---|---|---|---|---|---|
| Liberal Democrats | Rod Blyth | 1,106 | 42.9 | -11.0 | |
| UKIP | Peter Brown | 704 | 27.3 | +27.3 | |
| Labour | Hermione Spiggott | 548 | 21.2 | -11.1 | |
| Conservative | Judith Haughton | 222 | 8.6 | -5.5 | |
| Majority | 402 | 15.6 | -5.7 | ||
| Turnout | 2,580 | ||||
| Liberal Democrats hold | Swing | ||||
St. James ward (2)
| Party | Candidate | Votes | % | ±% | |
|---|---|---|---|---|---|
| Labour | Ginny Alexander | 831 | 20.7 | ||
| Labour | Angela Cosgrove | 689 | 17.2 | ||
| UKIP | Joseph Fitzpatrick | 654 | 16.3 | ||
| UKIP | Muriel Taylor | 605 | 15.1 | ||
| Liberal Democrats | Roger Hindle | 489 | 12.2 | ||
| Liberal Democrats | Stephen Barrow | 460 | 11.5 | ||
| Conservative | Edna Wolstenhulme | 146 | 3.6 | ||
| Green | Roger Pakeman | 131 | 3.3 | ||
| Majority | |||||
| Turnout | 4,005 | ||||
| Labour gain from Liberal Democrats | Swing | {{{swing}}} | |||
| Labour hold | Swing | {{{swing}}} | |||
St. Mary's ward
| Party | Candidate | Votes | % | ±% | |
|---|---|---|---|---|---|
| Labour | Ali Salamat | 2,900 | 82.2 | +23.8 | |
| Conservative | David Atherton | 213 | 6.0 | +3.7 | |
| Liberal Democrats | Sharon McGladdery | 211 | 6.0 | -30.0 | |
| Green | Miranda Meadowcroft | 204 | 3.3 | +2.5 | |
| Majority | 2,687 | 76.2 | +53.8 | ||
| Turnout | 3,528 | ||||
| Labour hold | Swing | ||||
Waterhead ward
| Party | Candidate | Votes | % | ±% | |
|---|---|---|---|---|---|
| Labour | Riaz Ahmad | 1,198 | 43.2 | -15.3 | |
| UKIP | Nicholas Godleman | 755 | 27.2 | +27.2 | |
| Liberal Democrats | Linda Dawson | 687 | 24.8 | -16.7 | |
| Conservative | Sarah Afzaal | 131 | 4.7 | +4.7 | |
| Majority | 443 | 16.0 | -1.1 | ||
| Turnout | 2,771 | ||||
| Labour gain from Liberal Democrats | Swing | ||||
Werneth ward
| Party | Candidate | Votes | % | ±% | |
|---|---|---|---|---|---|
| Labour | Shoab Akhtar | 3,074 | 90.3 | +23.9 | |
| Conservative | Michele Stockton | 193 | 5.7 | +2.0 | |
| Liberal Democrats | Ron Wise | 137 | 4.0 | +1.1 | |
| Majority | 2,881 | 84.6 | +45.1 | ||
| Turnout | 3,404 | ||||
| Labour hold | Swing | ||||
References
- ↑ "England council results". BBC News. Retrieved 23 May 2014.
This article is issued from Wikipedia. The text is licensed under Creative Commons - Attribution - Sharealike. Additional terms may apply for the media files.