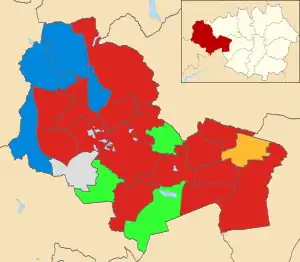
Map of the results of the 2007 Wigan council election. Labour in red, Conservatives in blue, Community Action Party in green, Liberal Democrats in yellow and independent in grey.
Elections to Wigan Council were held on 3 May 2007 with one third of the seats up for election.[1][2][3][4]
Election result
| Party | Seats | Gains | Losses | Net gain/loss | Seats % | Votes % | Votes | +/− | |
|---|---|---|---|---|---|---|---|---|---|
| Labour | 16 | 4 | 1 | +3 | 64.0 | 43.2 | 30,854 | +0.4% | |
| Conservative | 4 | 1 | 0 | +1 | 16.0 | 21.0 | 15,023 | -0.7% | |
| Community Action | 3 | 1 | 2 | -1 | 12.0 | 15.8 | 11,265 | -1.0% | |
| Liberal Democrats | 1 | 0 | 2 | -2 | 4.0 | 10.1 | 7,211 | -1.7% | |
| Independent | 1 | 0 | 0 | 0 | 4.0 | 3.2 | 2,267 | +2.0% | |
| BNP | 0 | 0 | 0 | 0 | 0 | 3.6 | 2,572 | +0.8% | |
| Community Performance First | 0 | 0 | 1 | -1 | 0 | 1.2 | 837 | +1.2% | |
| Green | 0 | 0 | 0 | 0 | 0 | 1.2 | 835 | +0.3% | |
| UKIP | 0 | 0 | 0 | 0 | 0 | 0.5 | 337 | -1.1% | |
This result had the following consequences for the total number of seats on the Council after the elections:[5]
| Party | Previous council | New council | |||
|---|---|---|---|---|---|
| Labour | 43 | 46 | |||
| Community Action | 12 | 11 | |||
| Conservative | 9 | 10 | |||
| Liberal Democrat | 8 | 6 | |||
| Independent | 2 | 2 | |||
| BNP | 0 | 0 | |||
| Green | 0 | 0 | |||
| Community Performance First | 1 | 0 | |||
| UKIP | 0 | 0 | |||
| Total | 75 | 75 | |||
| Working majority | 11 | 17 | |||
Ward results
| Party | Candidate | Votes | % | ±% | |
|---|---|---|---|---|---|
| Labour | Eunice Smethurst | 1,403 | 55.0 | +2.9 | |
| Community Action | John Shale | 587 | 22.2 | +1.0 | |
| BNP | Dennis Shambley | 309 | 12.1 | -4.4 | |
| Conservative | Marion Green | 264 | 10.4 | +0.8 | |
| Rejected ballots | 6 | 0.2 | -0.3 | ||
| Majority | 836 | 32.8 | +1.9 | ||
| Turnout | 2,549 | 24.8 | -0.2 | ||
| Labour hold | Swing | +0.9 | |||
| Party | Candidate | Votes | % | ±% | |
|---|---|---|---|---|---|
| Community Action | Walter Carney | 1,423 | 45.4 | +2.2 | |
| Labour | Ann Rampling | 1,258 | 40.1 | -5.2 | |
| Conservative | Marie Winstanley | 256 | 8.2 | -3.3 | |
| BNP | Violet Haslam | 195 | 6.2 | +6.2 | |
| Rejected ballots | 5 | 0.2 | +0.2 | ||
| Majority | 165 | 5.3 | +3.1 | ||
| Turnout | 3,137 | 34.4 | +4.1 | ||
| Community Action hold | Swing | +3.7 | |||
| Party | Candidate | Votes | % | ±% | |
|---|---|---|---|---|---|
| Labour | Chris Ready | 1,888 | 53.1 | +12.8 | |
| Liberal Democrats | Alan Robinson | 1,017 | 28.6 | -15.2 | |
| Conservative | Jim Waterworth | 463 | 13.0 | -2.8 | |
| Green | Norma Stout | 174 | 4.9 | +4.9 | |
| Rejected ballots | 13 | 0.4 | +0.4 | ||
| Majority | 871 | 24.5 | +21.0 | ||
| Turnout | 3,555 | 35.6 | +3.7 | ||
| Labour hold | Swing | +14.0 | |||
| Party | Candidate | Votes | % | ±% | |
|---|---|---|---|---|---|
| Labour | Brendan Bowen | 1,048 | 37.9 | +9.2 | |
| Conservative | Sean Ell | 821 | 29.7 | +7.3 | |
| Liberal Democrats | Peter Bowdler | 665 | 24.0 | -24.8 | |
| Green | Ian Davies | 218 | 7.9 | +7.9 | |
| Rejected ballots | 14 | 0.5 | +0.5 | ||
| Majority | 227 | 8.2 | -12.0 | ||
| Turnout | 2,766 | 28.6 | -2.5 | ||
| Labour gain from Liberal Democrats | Swing | +0.9 | |||
| Party | Candidate | Votes | % | ±% | |
|---|---|---|---|---|---|
| Labour | Mark Aldred | 1,104 | 52.1 | +6.1 | |
| Liberal Democrats | Kevin Jones | 640 | 30.2 | -4.1 | |
| Conservative | Dorothy Angell | 366 | 17.3 | -2.4 | |
| Rejected ballots | 10 | 0.5 | +0.5 | ||
| Majority | 464 | 21.9 | +10.2 | ||
| Turnout | 2,120 | 26.8 | +0.9 | ||
| Labour hold | Swing | +5.1 | |||
| Party | Candidate | Votes | % | ±% | |
|---|---|---|---|---|---|
| Labour | Norman Bradbury | 1,456 | 45.3 | -4.4 | |
| Liberal Democrats | David Higginbottom | 1,211 | 37.7 | +6.0 | |
| Conservative | Lee Kendrick-Walker | 352 | 11.0 | +0.0 | |
| Green | Nicolas Redmond | 183 | 5.7 | -2.0 | |
| Rejected ballots | 10 | 0.3 | +0.3 | ||
| Majority | 245 | 7.6 | -10.4 | ||
| Turnout | 3,212 | 29.5 | +1.9 | ||
| Labour gain from Liberal Democrats | Swing | -5.2 | |||
| Party | Candidate | Votes | % | ±% | |
|---|---|---|---|---|---|
| Independent | Gary Wilkes | 1,657 | 52.3 | +52.3 | |
| Labour | George Harrison | 1,030 | 32.3 | -0.9 | |
| BNP | Kenneth Haslam | 307 | 9.6 | -4.8 | |
| Conservative | Jonathan Cartwright | 179 | 5.6 | +0.2 | |
| Rejected ballots | 7 | 0.2 | +0.0 | ||
| Majority | 637 | 20.0 | +8.0 | ||
| Turnout | 3,190 | 34.3 | +0.6 | ||
| Independent hold | Swing | +26.6 | |||
| Party | Candidate | Votes | % | ±% | |
|---|---|---|---|---|---|
| Labour | Mike Dewhurst | 1,338 | 58.0 | -1.1 | |
| Community Action | James Carmichael-Prince | 586 | 25.4 | -14.9 | |
| Conservative | Jean Peet | 374 | 16.2 | +16.2 | |
| Rejected ballots | 10 | 0.4 | -0.2 | ||
| Majority | 752 | 32.6 | +13.8 | ||
| Turnout | 2,308 | 24.4 | -0.4 | ||
| Labour hold | Swing | +6.9 | |||
| Party | Candidate | Votes | % | ±% | |
|---|---|---|---|---|---|
| Labour | Mark Klieve | 1,520 | 56.4 | +4.4 | |
| Community Action | Kevin Williams | 777 | 28.8 | -6.3 | |
| Conservative | James Grundy | 388 | 14.4 | +1.6 | |
| Rejected ballots | 11 | 0.4 | +0.4 | ||
| Majority | 743 | 27.6 | +10.7 | ||
| Turnout | 2,696 | 30.3 | -0.4 | ||
| Labour gain from Community Action | Swing | +5.3 | |||
| Party | Candidate | Votes | % | ±% | |
|---|---|---|---|---|---|
| Labour | James Ecclles-Churton | 1,191 | 45.3 | -3.1 | |
| Community Action | Jim Ellis | 1,142 | 43.4 | +7.1 | |
| Conservative | William Winstanley | 289 | 11.0 | -4.4 | |
| Rejected ballots | 9 | 0.3 | +0.3 | ||
| Majority | 49 | 1.9 | -10.2 | ||
| Turnout | 2,631 | 26.6 | +1.1 | ||
| Labour gain from Community Action | Swing | -5.1 | |||
| Party | Candidate | Votes | % | ±% | |
|---|---|---|---|---|---|
| Community Action | Louise Fagan | 741 | 31.4 | -16.0 | |
| Labour | Martin Long | 710 | 30.1 | -5.8 | |
| Community Performance First | Robert Brierley | 654 | 27.7 | +27.7 | |
| Conservative | Margaret Winstanley | 245 | 10.4 | -6.3 | |
| Rejected ballots | 8 | 0.3 | +0.3 | ||
| Majority | 31 | 1.3 | -10.3 | ||
| Turnout | 2,358 | 26.4 | +0.6 | ||
| Community Action gain from Community Performance First | Swing | -5.1 | |||
| Party | Candidate | Votes | % | ±% | |
|---|---|---|---|---|---|
| Labour | Joan Hurst | 1,348 | 66.5 | +5.7 | |
| Community Action | Yvonne Maddison | 458 | 22.6 | -7.8 | |
| Conservative | Anthony Hinds | 210 | 10.4 | +2.1 | |
| Rejected ballots | 12 | 0.6 | -0.1 | ||
| Majority | 890 | 43.9 | +13.5 | ||
| Turnout | 2,028 | 23.6 | -1.0 | ||
| Labour hold | Swing | +6.7 | |||
| Party | Candidate | Votes | % | ±% | |
|---|---|---|---|---|---|
| Labour | Christine Cottam | 1,204 | 48.1 | +2.1 | |
| Liberal Democrats | Gordon Jackson | 778 | 31.1 | -6.4 | |
| Conservative | Andrew Oxley | 501 | 20.0 | +3.6 | |
| Rejected ballots | 18 | 0.7 | +0.7 | ||
| Majority | 426 | 17.0 | +8.5 | ||
| Turnout | 2,501 | 27.0 | +0.2 | ||
| Labour hold | Swing | +4.2 | |||
| Party | Candidate | Votes | % | ±% | |
|---|---|---|---|---|---|
| Labour | John O'Brien | 1,408 | 43.3 | +3.5 | |
| Community Action | Ian Franzen | 774 | 23.8 | +4.4 | |
| Conservative | Rosina Oxley | 762 | 23.4 | -0.4 | |
| BNP | Richard Close | 293 | 9.0 | -5.0 | |
| Rejected ballots | 15 | 0.5 | +0.5 | ||
| Majority | 634 | 19.5 | +3.5 | ||
| Turnout | 3,252 | 31.1 | +0.5 | ||
| Labour hold | Swing | -0.4 | |||
| Party | Candidate | Votes | % | ±% | |
|---|---|---|---|---|---|
| Labour | Myra Whiteside | 1,380 | 53.9 | -1.0 | |
| Independent | Mandy Cooper | 600 | 23.5 | +23.5 | |
| Conservative | Denise Young | 289 | 11.3 | -5.0 | |
| Community Action | Stephen Ellison | 280 | 10.9 | +10.9 | |
| Rejected ballots | 9 | 0.4 | +0.4 | ||
| Majority | 780 | 30.5 | +4.3 | ||
| Turnout | 2,558 | 23.8 | +0.4 | ||
| Labour hold | Swing | -12.2 | |||
| Party | Candidate | Votes | % | ±% | |
|---|---|---|---|---|---|
| Community Action | Jonathan Miller | 1,418 | 43.0 | +8.9 | |
| Labour | Susan Greensmith | 1,085 | 32.9 | +0.1 | |
| Conservative | Jeanette Leigh | 782 | 23.7 | -9.3 | |
| Rejected ballots | 13 | 0.4 | +0.4 | ||
| Majority | 636 | 10.1 | +9.0 | ||
| Turnout | 3,298 | 33.6 | +1.4 | ||
| Community Action hold | Swing | +4.4 | |||
| Party | Candidate | Votes | % | ±% | |
|---|---|---|---|---|---|
| Conservative | Michael Winstanley | 1,686 | 45.2 | +6.8 | |
| Labour | Michael Barnes | 1,328 | 35.6 | -1.6 | |
| BNP | Charles Mather | 534 | 14.3 | -3.9 | |
| Community Action | Peter Solinas | 165 | 4.4 | +4.4 | |
| Rejected ballots | 13 | 0.3 | +0.3 | ||
| Majority | 358 | 9.6 | +8.4 | ||
| Turnout | 3,726 | 40.3 | +3.2 | ||
| Conservative hold | Swing | +4.2 | |||
| Party | Candidate | Votes | % | ±% | |
|---|---|---|---|---|---|
| Labour | Barbara Bourne | 1,421 | 57.6 | -7.1 | |
| Community Action | Michael Leyland | 409 | 16.6 | +2.3 | |
| BNP | Chris Hilton | 333 | 13.5 | +13.5 | |
| Conservative | Stuart Foy | 295 | 12.0 | +12.0 | |
| Rejected ballots | 8 | 0.3 | +0.3 | ||
| Majority | 1,012 | 41.0 | -9.5 | ||
| Turnout | 2,466 | 24.9 | +2.2 | ||
| Labour hold | Swing | -4.7 | |||
| Party | Candidate | Votes | % | ±% | |
|---|---|---|---|---|---|
| Conservative | Debbie Fairhurst | 1,377 | 41.9 | -15.5 | |
| Labour | Dave Brown | 1,248 | 38.0 | -3.2 | |
| UKIP | John Atherton | 337 | 10.3 | +10.3 | |
| Liberal Democrats | Darren Atherton | 311 | 9.5 | +9.5 | |
| Rejected ballots | 11 | 0.3 | -1.1 | ||
| Majority | 129 | 3.9 | -12.3 | ||
| Turnout | 3,284 | 34.9 | +1.1 | ||
| Conservative gain from Labour | Swing | -6.1 | |||
| Party | Candidate | Votes | % | ±% | |
|---|---|---|---|---|---|
| Conservative | George Fairhurst | 2,016 | 57.9 | +3.1 | |
| Labour | Mike Crosby | 996 | 28.6 | -1.6 | |
| Liberal Democrats | June Garner | 451 | 12.9 | +12.9 | |
| Rejected ballots | 20 | 0.6 | +0.1 | ||
| Majority | 1,020 | 29.3 | +4.7 | ||
| Turnout | 3,483 | 36.4 | +0.4 | ||
| Conservative hold | Swing | +2.3 | |||
| Party | Candidate | Votes | % | ±% | |
|---|---|---|---|---|---|
| Liberal Democrats | Keith McManus | 1,838 | 63.0 | +4.3 | |
| Labour | Pamela Stewart | 447 | 15.3 | -4.0 | |
| Conservative | Hilary Hayden | 370 | 12.7 | +3.6 | |
| Green | Craig Cohen | 260 | 8.9 | -4.0 | |
| Rejected ballots | 3 | 0.1 | +0.1 | ||
| Majority | 1,391 | 47.7 | +8.3 | ||
| Turnout | 2,918 | 28.6 | -0.3 | ||
| Liberal Democrats hold | Swing | +4.2 | |||
| Party | Candidate | Votes | % | ±% | |
|---|---|---|---|---|---|
| Conservative | Jim Davies | 1,406 | 44.2 | -15.8 | |
| Labour | John Ball | 1,050 | 33.0 | -7.0 | |
| Liberal Democrats | Martin Sutton | 300 | 9.4 | +9.4 | |
| Community Action | Ronnie Barnes | 218 | 6.9 | +6.9 | |
| BNP | Gary Chadwick | 199 | 6.3 | +6.3 | |
| Rejected ballots | 9 | 0.3 | +0.3 | ||
| Majority | 356 | 11.2 | -8.8 | ||
| Turnout | 3,182 | 34.6 | +0.1 | ||
| Conservative hold | Swing | -4.4 | |||
| Party | Candidate | Votes | % | ±% | |
|---|---|---|---|---|---|
| Labour | Mike Baines | 1,388 | 47.5 | -1.5 | |
| Conservative | Keith Jones | 563 | 19.3 | -2.9 | |
| Community Action | Philip Parkes | 560 | 19.2 | +19.2 | |
| BNP | Susan Mather | 402 | 13.7 | +13.7 | |
| Rejected ballots | 11 | 0.4 | -0.2 | ||
| Majority | 825 | 28.2 | +7.6 | ||
| Turnout | 2,924 | 28.6 | +1.7 | ||
| Labour hold | Swing | +0.7 | |||
| Party | Candidate | Votes | % | ±% | |
|---|---|---|---|---|---|
| Labour | Rona Winkworth | 1,224 | 43.3 | +9.4 | |
| Community Action | Leanne Brotherton | 1,109 | 39.2 | -4.2 | |
| Conservative | David Bowker | 482 | 17.1 | +2.7 | |
| Rejected ballots | 11 | 0.4 | +0.1 | ||
| Majority | 115 | 4.1 | -5.5 | ||
| Turnout | 2,826 | 32.0 | +1.9 | ||
| Labour hold | Swing | +6.8 | |||
| Party | Candidate | Votes | % | ±% | |
|---|---|---|---|---|---|
| Labour | William Rotherham | 1,381 | 55.3 | -0.1 | |
| Community Action | William Barnes | 638 | 25.5 | -5.5 | |
| Conservative | Thomas Sutton | 287 | 11.5 | -1.4 | |
| Community Performance First | Anthony Unsworth | 183 | 7.3 | +7.3 | |
| Rejected ballots | 9 | 0.4 | -0.3 | ||
| Majority | 743 | 29.7 | +5.4 | ||
| Turnout | 2,498 | 27.6 | +1.6 | ||
| Labour hold | Swing | +2.7 | |||
By-elections between 2007 and 2008
| Party | Candidate | Votes | % | ±% | |
|---|---|---|---|---|---|
| Liberal Democrats | Robert Bleakley | 784 | 40.2 | -22.8 | |
| Labour | Barry Taylor | 619 | 31.7 | +16.4 | |
| Independent | Craig Cohen | 377 | 19.3 | +19.3 | |
| Conservative | Sean Ell | 170 | 8.7 | -4.0 | |
| Majority | 165 | 8.5 | -39.2 | ||
| Turnout | 1,950 | 19.2 | -9.4 | ||
| Liberal Democrats hold | Swing | -19.6 | |||
| Party | Candidate | Votes | % | ±% | |
|---|---|---|---|---|---|
| Labour | Phyll Cullen | 837 | 43.7 | -3.8 | |
| Liberal Democrats | Trevor Beswick | 464 | 24.2 | +24.2 | |
| BNP | Susan Mather | 264 | 13.8 | +0.1 | |
| Community Action | Jim Carmichael-Prince | 219 | 11.4 | -7.8 | |
| Independent | Syd Hall | 72 | 3.8 | +3.8 | |
| Green | Norma Stout | 60 | 3.1 | +3.1 | |
| Majority | 373 | 19.5 | -8.7 | ||
| Turnout | 1,916 | 18.7 | -9.9 | ||
| Labour hold | Swing | -14.0 | |||
| Party | Candidate | Votes | % | ±% | |
|---|---|---|---|---|---|
| Conservative | Jean Peet | 1,013 | 48.2 | +4.0 | |
| Labour | Mike Barnes | 827 | 39.3 | +6.3 | |
| Community Action | John Shale | 262 | 12.5 | +5.6 | |
| Majority | 186 | 8.9 | -2.3 | ||
| Turnout | 2,102 | 22.8 | -11.8 | ||
| Conservative hold | Swing | -1.1 | |||
References
- ↑ "Local elections: Wigan". BBC News Online. Retrieved 2 January 2012.
- 1 2 3 4 5 6 7 8 9 10 11 12 13 14 15 16 17 18 19 20 21 22 23 24 25 26 "Wigan Council results from 1973 to 2008" (PDF). wigan.gov.uk. Archived from the original (PDF) on 20 November 2011. Retrieved 30 January 2012.
- 1 2 3 4 5 6 7 8 9 10 11 12 13 14 15 16 17 18 19 20 21 22 23 24 25 26 "Local Election Results 03 May 2007". wiganmbc.gov.uk. Retrieved 28 June 2012.
- 1 2 3 4 5 6 7 8 9 10 11 12 13 14 15 16 17 18 19 20 21 22 23 24 25 26 "Local Elections Archive Project: 2007 - Wigan". andrewteale.me.uk. Retrieved 28 June 2012.
- ↑ "Councillor Details". wiganmbc.gov.uk. Archived from the original on 11 November 2006. Retrieved 3 July 2012.
- ↑ "Tyldesley By Election Result – 28 June 2007". Wigan Council. Archived from the original on 23 February 2012. Retrieved 14 March 2010.
- 1 2 3 "Local Authority Byelection Results". gwydir.demon.co.uk. Archived from the original on 29 March 2010. Retrieved 13 June 2012.
- ↑ "Wigan West By Election Result – 20 September 2007". Wigan Council. Archived from the original on 23 February 2012. Retrieved 14 March 2010.
- ↑ "Wigan Central By-Election Result – 18 October 2007". Wigan Council. Archived from the original on 23 February 2012. Retrieved 14 March 2010.
This article is issued from Wikipedia. The text is licensed under Creative Commons - Attribution - Sharealike. Additional terms may apply for the media files.