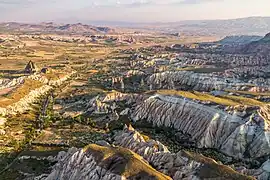
Aerial photograph interpretation is a method of extrapolating geological details of the ground surface from aerial images.[1] It allows geologists to analyze the distinguishing geological features and structures, plant cover, past history of the site, soil properties, and topography of the study area.[1][2] It is crucial in the early stage of a geological mapping as it is less time-consuming and offers important data at a minimal price.[1] It is also commonly used in other industries such as forest management, environmental science, disciplines of engineering, and investigating aviation accidents.[1][3][4]
Aerial photograph interpretation is also useful to assess the risk of landslides and other dangers in the natural environment in the geotechnical industry.[5] As proper interpretation of aerial photos can reveal historical changes of the topography and the details of previous landslides, it can be help determine whether an area is stable or not.[5][4] Geologists can further utilize the interpretations to design the most favorable locations for field studies and the acquisition of data.[5]
Geologic applications of aerial photographs
Landslide hazard assessment
Aerial photographs play an important role in assessing the risk of different natural hazards, particularly landslides.[1] They can be used to determine whether hillslopes are stable or not.[1] They can also record the history of landslides experienced in that area.[1] For example, in an area with more than half of the ground surface constitutes natural terrain, which is the unmodified natural environment, there are more slopes.[1] The majority of naturally occurring landslides happen in isolated locations, posing a threat to ongoing development.[1] Aerial photographs can be used to find all current and historical landslides in and around the research region to gauge vulnerability to future landslides.[1]
A landslide scar refers to the local area disrupted by the landslide.[5] It comprises the starting point, also called the "source", the detached substances and a trail that describes the movement of a landslide.[5] Every landslide scar is noted, along with its position, size, and the estimated date of the event. For the current landslides, in the photograph, they can be recognized easily by the unique light-colored landslide scar.[1] Very few plants can be observed on the scar.[1] For historical or old landslides, they may be hidden by vegetation such as bushes and woody plants, but scars in the land are still present.[1] This type of landslide is recognized by a concave depression that appears on a major steep slope.[1] Depression is when a feature is lowered compared to its surroundings. It is important to take into account the age of historical landslides and assess their applicability to the present climate and environment.[5]
Determining geological structures and types of rock
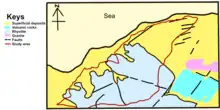
Aerial photographs can be used to identify different rock types on the rock exposure and the arrangement of the geological structures.[1][5] These structures are produced by deformation processes during tectonic movement, such as faults and folds. Geologists identify different geological features and structures based on photo-lineaments.[4][1] Photo-lineaments are lines that appear on the photos and are thought to be driven by geological factors.[1] Those identified photo-lineaments are aligned with the linear topographic landforms.[1] They can be referred to as joints, faults, dikes, or rock contacts.[1] Some faults may even occur along rivers and mountain valleys.[1]
For example, in Hong Kong the two major rocks are granite (35%) and volcanic rock (50%).[1] Since granite is more easily weathered and eroded than volcanic rocks, it usually forms gullies, which are the valleys on a smaller scale, whereas volcanic rocks form the summit, which is the location with a higher elevation in the mountains.[5][1]
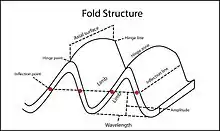
Another example of determining geological structures is a fold found in Wyoming in the United States.[6] A fold is developed when the rock layers are squeezed and curved by forces and do not break during the deformation.[7] It is an anticline which has the earliest-formed rock layers in the inner part and the youngest rock layer on the outer part of the fold.[8][9] The hinge line of this fold, which refers to a line tracing the maximum bend of the fold structure, is not a straight line.[9][6] The head and the tail of the hinge line dip downward from the original horizontal plane. It is an asymmetrical fold which means the axial plane is not in the upright orientation but inclined.[7] The axial plane is a hypothetical plane dividing two sides of the fold.[7] The limbs dip in opposite directions and are formed by tilted sedimentary rock layers.[6] Limbs belong to the straight sections on the two sides of a fold. Aerial photographs are helpful for geologists to observe large-scale geological structures without spending large amounts of time in fields.
Boulder survey
Boulder surveys determine and categorize the areas of boulders using aerial photograph interpretation.[1] After the survey the properties (dimension, amount, form) of boulders are combined with the geological map. This helps detect dangers from the falling of these large rock pieces, especially when conducting new projects close to the hillsides.[1]
Dense forests may obstruct the view of boulders from aerial photographs, which is one of the limitations of using aerial photographs to conduct a boulder survey.[1] Therefore, old aerial photographs with less vegetation are usually more beneficial for boulder mapping. Hillslopes are often occupied by some small village houses which produce a shadow.[1] These factors may decrease the efficiency of the boulder survey whereas bare ground allows for typically good sight of the terrain.[1]
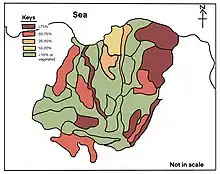
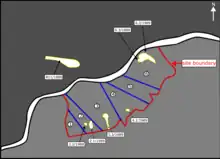
Geologists mark down the locations of the boulders on maps after making observations from aerial photographs to develop a sense of the possible boulder locations before going to the site. For example, from figure 17, it is observed that several boulders were settled on the hillslopes along the nearby footpaths. From the vertical view of the aerial photograph, the positions and relative dimensions of the boulders can be determined and measured easily. For an initial assessment of boulders on a wide and isolated landscape, conducting a boulder survey is necessary.[1]
Studying landforms
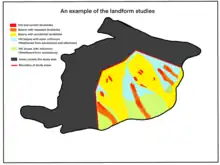
Aerial photographs can be used to help study, recognize, and classify landforms, which refers to the topographical characteristics created by the environmental systems.[1] They usually contain some distinct components and sets of features.[1] Certain fundamental spatial distributions of features are used to distinguish different landforms.[1] Differences in terrain surface elevation, river flow, colors of the aerial photographs, spatial distribution of tones, and the occurrence of plant covers are considered during landform studies.[1] Watersheds, which refer to the regions that separate drainage basins, are able to be defined using small-scale aerial photographs.[5] Landform studies also help identify decreases in surface elevation in natural terrain. and river courses[5]
Regolith mapping
Regolith mapping helps distinguish different kinds of superficial deposits which refer to loosely arranged aggregates of weathered materials on the land surface.[1][10] Aerial photographs can be used to establish the borders between the fluvial and gravity-driven hillslope sediments.[1] These superficial deposits usually have indistinct borders.[1] Some examples of the deposits identified using regolith mapping are described below.
Valley colluvium
Valley colluvium refers to the loose, unconsolidated sediments that have been settled inside the water courses and are driven by river mechanisms.[1] They are thin in shape and extended into straight lines that follow the river channels.[1] The plants grown on the valley colluvium are thicker than the nearby areas.[1] Woody plants and large bushes dominate the vegetation.[1]
Debris fan colluvium
Debris fan colluvium refers to the aggregates of gravity-driven and fluvial deposits located near the hillslope's base or the eroded catchment area.[1] It appears shell-like from the vertical view and is cut by the flowing rivers.[1] In certain parts of the debris fan, there may be some woody plants covering the land surface.[1]

Agricultural terraces
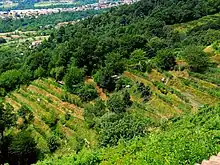
Regolith mapping can also be used to determine disrupted natural landscapes in aerial photographs.[1] For example, agricultural terraces, which refers to the level land surfaces divided by short back slopes and concrete barriers, is one of the disrupted landscapes.[1] Back slopes refer to the slopes constructed by removing soil or rocks from hillslopes for nearby infrastructure. They were developed for the purpose of growing rice.[1] The terraces are usually found on gentle slopes and bottom areas of the mountains.[1] They are usually covered with thick vegetation when the terraces are abandoned, or the farming activities are no longer active.[1]
References
- 1 2 3 4 5 6 7 8 9 10 11 12 13 14 15 16 17 18 19 20 21 22 23 24 25 26 27 28 29 30 31 32 33 34 35 36 37 38 39 40 41 42 43 44 45 46 47 48 49 50 51 Ho, H (2004). "Application of aerial photograph interpretation in geotechnical practice in Hong Kong (MSc thesis)". University of Hong Kong, Pokfulam, Hong Kong SAR. doi:10.5353/th_b4257758.
- ↑ National Council of Educational Research and Training. (2006). Introduction To Aerial Photographs. In Practical Work In Geography (pp. 69–83). Publication Division by the Secretary. https://www.philoid.com/epub/ncert/11/214/
- ↑ Legislative Council of Hong Kong. (2011). Legislative Council Panel on Development, Procurement of One Set of Large Format Digital Aerial Camera System (CB(1)1648/10-11(01)). https://www.legco.gov.hk/yr10-11/english/panels/dev/papers/devcb1-1648-1-e.pdf
- 1 2 3 Geotechnical Engineering Office, Civil Engineering and Development Department. (1987). Guide to Site Investigation (Geoguide 2) (pp. 1–352) https://www.cedd.gov.hk/filemanager/eng/content_108/eg2_20171218.pdf
- 1 2 3 4 5 6 7 8 9 10 Ho, H., & Roberts, K. (2016). Guidelines for Natural Terrain Hazard Studies, Second Edition. Geotechnical Engineering Office, Civil Engineering and Development Department. https://www.cedd.gov.hk/filemanager/eng/content_293/er138links.pdf
- 1 2 3 Lisle, R. J. (2003). Dupin's indicatrix: a tool for quantifying periclinal folds on maps. Geological magazine, 140(6), 721–726.
- 1 2 3 Geological Folds. (26 December 2015). Geology Page. https://www.geologypage.com/2015/12/geological-folds.html
- ↑ De Paor, D. G., Dordevic, M. M., Karabinos, P., Tewksbury, B. J., & Whitmeyer, S. J. (2016). The fold analysis challenge: A virtual globe-based educational resource. Journal of Structural Geology, 85, 85–94.
- 1 2 The National Park Service. (7 December 2021). Glossary of Geologic Terms. NPS.gov (U.S. National Park Service). Retrieved 5 November 2022, from https://www.nps.gov/subjects/geology/gri-glossary-of-geologic-terms.htm
- ↑ Hong Kong Geological Survey, Civil Engineering and Development Department. (2009). Weathering & Erosion – Introduction to Geomorphological Processes.https://hkss.cedd.gov.hk/hkss/eng/education/gs/eng/hkg/chapter4.htm?tab=2.
