Bungotakada
豊後高田市 | |
|---|---|
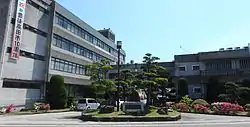
 Bungotakada city hall | |
 Flag  Emblem | |
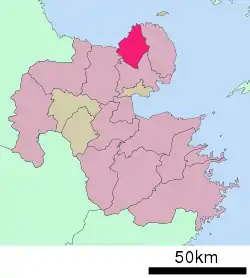
Location of Bungotakada in Ōita Prefecture | |
 | |
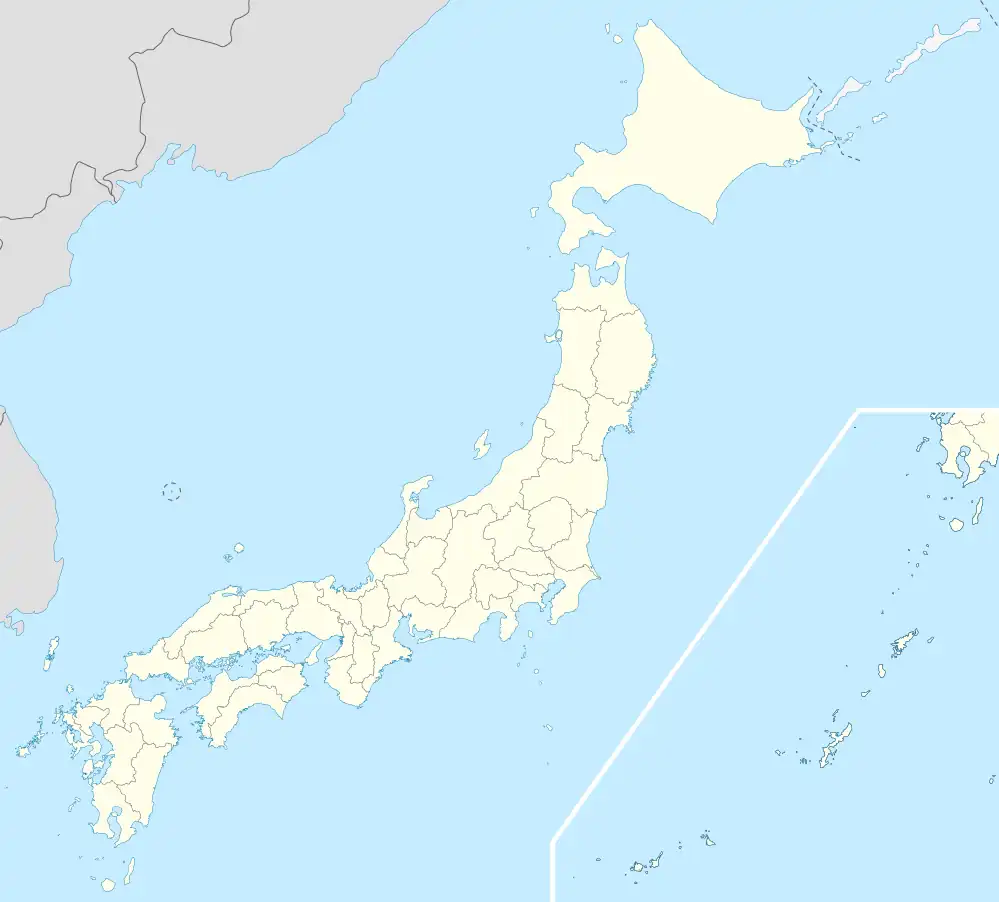
 Bungotakada Location in Japan | |
| Coordinates: 33°33′22″N 131°26′49″E / 33.55611°N 131.44694°E | |
| Country | Japan |
| Region | Kyushu |
| Prefecture | Ōita |
| Government | |
| • Mayor | Toshio Sasaki (since 2017) |
| Area | |
| • Total | 206.24 km2 (79.63 sq mi) |
| Population (November 30, 2023) | |
| • Total | 21,980 |
| • Density | 110/km2 (280/sq mi) |
| Time zone | UTC+09:00 (JST) |
| City hall address | 1650 Ōji-Aiai, Bungotakada-shi, Ōita-ken 878-8555 |
| Climate | Cfa |
| Website | Official website |
| Symbols | |
| Flower | Cosmos |
| Tree | Diospyros kaki |
Bungotakada (豊後高田市, Bungotakada-shi) is a city located in Ōita Prefecture, Kyushu, Japan. As of 30 November 2023, the city had an estimated population of 21,980 in 11038 households, and a population density of 96 persons per km². [1] The total area of the city is 206.24 km2 (79.63 sq mi).
Geography
Bungotakada is located in the western part of the Kunisaki Peninsula in northern Ōita Prefecture, facing the Gulf of Suō at the edge of the Seto Inland Sea. The city center is located in the Takada area, which stretches across the plains along the Katsura River and was once a prosperous shipping and commercial town. In the Tamatsu district to the north, there is a hilly area that the ruins of Takada Castle, and its jōkamachi castle town was developed from the Edo period onwards. It is located approximately 30 minutes by car from Nakatsu City and approximately one hour by car from the prefectural capital at Ōita City.
Neighboring municipalities
Climate
Bungotakada has a humid subtropical climate (Köppen climate classification Cfa) with hot summers and cool winters. Precipitation is significant throughout the year, but is somewhat lower in winter. The average annual temperature in Bungotakada is 15.9 °C (60.6 °F). The average annual rainfall is 1,992.2 mm (78.43 in) with June as the wettest month. The temperatures are highest on average in August, at around 24.5 °C (76.1 °F), and lowest in January, at around 2.3 °C (36.1 °F).[2] The highest temperature ever recorded in Bungotakada was 37.4 °C (99.3 °F) on 17 July 1994; the coldest temperature ever recorded was −6.9 °C (19.6 °F) on 3 February 2012.[3]
| Climate data for Bungotakada (1991−2020 normals, extremes 1977−present) | |||||||||||||
|---|---|---|---|---|---|---|---|---|---|---|---|---|---|
| Month | Jan | Feb | Mar | Apr | May | Jun | Jul | Aug | Sep | Oct | Nov | Dec | Year |
| Record high °C (°F) | 18.9 (66.0) |
24.5 (76.1) |
27.2 (81.0) |
29.7 (85.5) |
32.2 (90.0) |
34.5 (94.1) |
37.4 (99.3) |
36.9 (98.4) |
35.2 (95.4) |
32.4 (90.3) |
27.9 (82.2) |
26.3 (79.3) |
37.4 (99.3) |
| Mean daily maximum °C (°F) | 9.3 (48.7) |
10.3 (50.5) |
13.8 (56.8) |
19.1 (66.4) |
23.8 (74.8) |
26.8 (80.2) |
30.8 (87.4) |
32.0 (89.6) |
28.0 (82.4) |
22.9 (73.2) |
17.4 (63.3) |
11.8 (53.2) |
20.5 (68.9) |
| Daily mean °C (°F) | 5.3 (41.5) |
6.0 (42.8) |
9.1 (48.4) |
13.9 (57.0) |
18.6 (65.5) |
22.3 (72.1) |
26.3 (79.3) |
27.3 (81.1) |
23.6 (74.5) |
18.2 (64.8) |
12.8 (55.0) |
7.6 (45.7) |
15.9 (60.6) |
| Mean daily minimum °C (°F) | 1.1 (34.0) |
1.6 (34.9) |
4.2 (39.6) |
8.7 (47.7) |
13.7 (56.7) |
18.7 (65.7) |
22.9 (73.2) |
23.6 (74.5) |
19.9 (67.8) |
13.8 (56.8) |
8.2 (46.8) |
3.2 (37.8) |
11.6 (53.0) |
| Record low °C (°F) | −5.5 (22.1) |
−6.9 (19.6) |
−4.6 (23.7) |
−0.5 (31.1) |
4.4 (39.9) |
10.0 (50.0) |
15.2 (59.4) |
17.1 (62.8) |
8.2 (46.8) |
3.1 (37.6) |
−0.7 (30.7) |
−4.2 (24.4) |
−6.9 (19.6) |
| Average precipitation mm (inches) | 47.8 (1.88) |
61.9 (2.44) |
93.3 (3.67) |
103.8 (4.09) |
119.2 (4.69) |
260.8 (10.27) |
251.4 (9.90) |
132.7 (5.22) |
169.3 (6.67) |
94.6 (3.72) |
63.8 (2.51) |
49.3 (1.94) |
1,457.4 (57.38) |
| Average precipitation days (≥ 1.0 mm) | 6.6 | 8.0 | 9.9 | 9.8 | 8.9 | 13.0 | 11.2 | 8.9 | 9.8 | 6.4 | 7.7 | 6.8 | 107 |
| Mean monthly sunshine hours | 138.7 | 143.8 | 177.9 | 201.2 | 212.9 | 149.4 | 194.9 | 225.0 | 166.9 | 175.0 | 147.1 | 132.8 | 2,059.6 |
| Source: Japan Meteorological Agency[3][2] | |||||||||||||
Demographics
Per Japanese census data, the population of Bungotakada in 2020 is 22,112 people.[4] Bungotakada has been conducting censuses since 1950.
| Year | Pop. | ±% |
|---|---|---|
| 1950 | 49,214 | — |
| 1955 | 47,324 | −3.8% |
| 1960 | 43,381 | −8.3% |
| 1965 | 37,811 | −12.8% |
| 1970 | 33,561 | −11.2% |
| 1975 | 31,527 | −6.1% |
| 1980 | 30,705 | −2.6% |
| 1985 | 29,812 | −2.9% |
| 1990 | 28,798 | −3.4% |
| 1995 | 27,337 | −5.1% |
| 2000 | 26,206 | −4.1% |
| 2005 | 25,114 | −4.2% |
| 2010 | 23,918 | −4.8% |
| 2015 | 22,853 | −4.5% |
| 2020 | 22,112 | −3.2% |
| Bungotakada population statistics[4] | ||
History
The area of Bungotakada was part of ancient Bungo Province, although some portions were part of ancient Buzen Province. From the Nara period and Heian period, numerous Buddhist temples were constructed in the mountains of the Kunisaki Peninsula]] During the Edo period it was mostly under control of Shimabara Domain and was ruled by a cadet branch of the Matsudaira clan, with smaller areas under control of Nobeoka Domain. After the Meiji restoration, the town of Takada within Nishikunisaki District, Ōita was established on May 1, 1889 with the creation of the modern municipalities system. It changed its name to Bungotakada on May 10, 1954 and on May 31 of the same year was raised to city status.
On March 31, 2005, the towns of Kakaji and Matama (both from Nishikunisaki District) were merged into Bungotakada.
Government
Bungotakada has a mayor-council form of government with a directly elected mayor and a unicameral city council of 16 members. Bungotakada contributes one member to the Ōita Prefectural Assembly. In terms of national politics, the city is part of the Ōita 3rd district of the lower house of the Diet of Japan.
Economy
The economy of Bungotakada is based primarily on agriculture, with the area known for its negi (Welsh onions).
Education
Bungotakada has ten public elementary schools and five public junior high schools and on combined elementary/junior high school operated by the city government and one public high school operated by the Ōita Prefectural Board of Education.
Transportation
Railways
Bungotakada has no passenger railway service. The nearest station is Usa Station on the JR Kyushu Nippō Main Line, which is approximately four kilometers away from the Bungotakada urban center.
Highways
Local attractions
- Fuki-ji, Buddhist temple established in 718 AD with National Treasure Main Hall
- Maki Ōdō
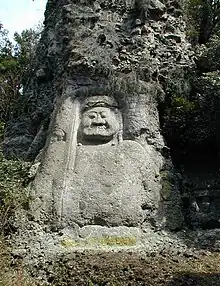
- Kumano magaibutsu, National Historic Site
- Shōwa no Machi Town
 Fudō-Myoō Stature in Kumano Magaibutsu
 Shōwa Style Town Visitor Attraction (Shōwa no Machi in Japanese) in Bungotakada.
References
- ↑ "Bungotakada City official statistics" (in Japanese). Japan.
- 1 2 気象庁 / 平年値(年・月ごとの値). JMA. Retrieved April 28, 2022.
- 1 2 観測史上1~10位の値(年間を通じての値). JMA. Retrieved April 28, 2022.
- 1 2 Bungotakada population statistics
External links
- Bungotakada City official website (in Japanese)