
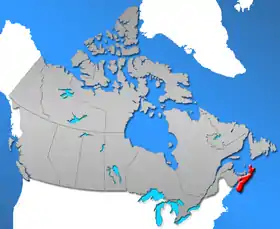
Nova Scotia (Latin for New Scotland; French: Nouvelle-Écosse; Scottish Gaelic: Alba Nuadh) is a Canadian province located on the country's southeastern coast. It is the most populous province in Atlantic Canada, and its capital, Halifax, is a major economic centre of the region. Geographically, Nova Scotia is the second smallest province in Canada, with an area of 52,824.71 km2 (20,395.73 sq mi). As of 2021, it has a population of 969,383 people.[1]
History
| |||||||||||||||||||||||||||||||||||||||||||||||||||||||||||||||||||||||||||||||||||||||||||||||||||||||||||||||||||||||
Source:[2] Statistics Canada [3][4]
* among provinces.
** Preliminary 2006 census estimate.
Population geography
Population centres
The Halifax population centre is the largest urban area in Nova Scotia. Statistics Canada recognizes a total of 37 population centres in the province.[5]
The below table is a list of those population centres in Nova Scotia from the 2021 Census of Population as designated, named, and delineated by Statistics Canada.[6]
| Rank | Population centre[6] | Size group[6] | Population (2021)[6] | Population (2016)[6] | Change[6] | Land area (km2)[6] | Population density[6] |
|---|---|---|---|---|---|---|---|
| 1 | Halifax | Large urban | 348,634 | 317,334 | +9.9% | 238.29 | 1,463.1/km2 |
| 2 | Cape Breton - Sydney | Medium | 30,960 | 30,170 | +2.6% | 30.91 | 1,001.6/km2 |
| 3 | Truro | Small | 23,583 | 23,205 | +1.6% | 31.52 | 748.2/km2 |
| 4 | New Glasgow | Small | 19,316 | 19,137 | +0.9% | 29.82 | 647.8/km2 |
| 5 | Glace Bay | Small | 16,915 | 17,604 | −3.9% | 31.19 | 542.3/km2 |
| 6 | Kentville | Small | 14,905 | 14,449 | +3.2% | 27.98 | 532.7/km2 |
| 7 | Sydney Mines | Small | 12,353 | 12,823 | −3.7% | 18.11 | 682.1/km2 |
| 8 | Amherst | Small | 9,548 | 9,550 | 0.0% | 12.38 | 771.2/km2 |
| 9 | Bridgewater | Small | 8,790 | 8,532 | +3.0% | 13.63 | 644.9/km2 |
| 10 | Yarmouth | Small | 7,848 | 7,527 | +4.3% | 16.81 | 466.9/km2 |
| 11 | Kingston - Greenwood | Small | 7,118 | 6,879 | +3.5% | 17.22 | 413.4/km2 |
| 12 | New Waterford | Small | 6,723 | 7,416 | −9.3% | 9.23 | 728.4/km2 |
| 13 | Enfield - Lantz | Small | 6,583 | 6,807 | −3.3% | 11.67 | 564.1/km2 |
| 14 | Antigonish | Small | 5,620 | 5,079 | +10.7% | 5.88 | 955.8/km2 |
| 15 | Windsor | Small | 5,514 | 5,248 | +5.1% | 10.56 | 522.2/km2 |
| 16 | Wolfville | Small | 5,057 | 4,195 | +20.5% | 6.46 | 782.8/km2 |
| 17 | Still Water Lake | Small | 3,379 | 3,447 | −2.0% | 8.23 | 410.6/km2 |
| 18 | Port Hawkesbury | Small | 2,998 | 3,004 | −0.2% | 5 | 599.6/km2 |
| 19 | Springhill | Small | 2,654 | 2,743 | −3.2% | 4.84 | 548.3/km2 |
| 20 | Pictou | Small | 2,643 | 2,711 | −2.5% | 4.35 | 607.6/km2 |
| 21 | Eskasoni 3 | Small | 2,575 | 2,352 | +9.5% | 5.7 | 451.8/km2 |
| 22 | Liverpool | Small | 2,546 | 2,549 | −0.1% | 3.59 | 709.2/km2 |
| 23 | Berwick | Small | 2,455 | 2,517 | −2.5% | 4.31 | 569.6/km2 |
| 24 | Lunenburg | Small | 2,405 | 2,262 | +6.3% | 3.35 | 717.9/km2 |
| 25 | Lake Echo | Small | 2,365 | 2,515 | −6.0% | 4.76 | 496.8/km2 |
| 26 | Indian Brook 14 | Small | 2,332 | 655 | +256.0% | 3.89 | 599.5/km2 |
| 27 | Digby | Small | 2,001 | 2,060 | −2.9% | 3.16 | 633.2/km2 |
| 28 | Hantsport | Small | 1,542 | 1,560 | −1.2% | 2.89 | 533.6/km2 |
| 29 | Brookside | Small | 1,439 | 1,441 | −0.1% | 2.81 | 512.1/km2 |
| 30 | Shelburne | Small | 1,439 | 1,483 | −3.0% | 2.6 | 553.5/km2 |
| 31 | Middleton | Small | 1,429 | 1,391 | +2.7% | 2.72 | 525.4/km2 |
| 32 | Chester | Small | 1,371 | 1,362 | +0.7% | 3.23 | 424.5/km2 |
| 33 | Inverness | Small | 1,228 | 1,248 | −1.6% | 2.73 | 449.8/km2 |
| 34 | Centreville | Small | 1,159 | 1,129 | +2.7% | 2.36 | 491.1/km2 |
| 35 | Howie Centre | Small | 1,106 | 1,157 | −4.4% | 1.67 | 662.3/km2 |
| 36 | Hayes Subdivision | Small | 1,044 | 1,121 | −6.9% | 1.1 | 949.1/km2 |
| 37 | Port Williams | Small | 1,030 | 1,120 | −8.0% | 1.92 | 536.5/km2 |
Municipalities
Nova Scotia has four regional municipalities.
Towns
Nova Scotia has 26 towns, not including the former Town of Canso that dissolved to become part of Guysborough County on July 1, 2012, and the former Towns of Bridgetown and Springhill which dissolved on April 1, 2015.[8]
Ethnic origins
Note: the percentages do not necessarily add up to 100% as multiple responses are allowed. Ethnic origins with less than 2% of the responses are not listed.[9]
| Ethnic origin (Canada 2016 Census) | ||
|---|---|---|
| Population group | Population | % of total population |
| Canadian | 387,360 | 42.6% |
| Scottish | 272,880 | 30.0% |
| English | 262,375 | 28.9% |
| Irish | 195,865 | 21.6% |
| French | 149,625 | 16.5% |
| German | 97,555 | 10.7% |
| First Nations (Indigenous North American) | 48,640 | 5.4% |
| Dutch (Netherlands) | 32,045 | 3.5% |
| Métis | 26,025 | 2.9% |
| Acadian | 23,700 | 2.6% |
Visible minorities and Indigenous peoples
| Visible minority and Indigenous population (Canada 2021 Census)[10] | |||
|---|---|---|---|
| Population group | Population | % | |
| European[lower-alpha 1] | 809,995 | 84.7% | |
| Visible minority group | South Asian | 21,655 | 2.3% |
| Chinese | 11,600 | 1.2% | |
| Black | 28,220 | 3.0% | |
| Filipino | 6,615 | 0.7% | |
| Arab | 10,610 | 1.1% | |
| Latin American | 2,915 | 0.3% | |
| Southeast Asian | 2,400 | 0.3% | |
| West Asian | 1,875 | 0.2% | |
| Korean | 2,845 | 0.3% | |
| Japanese | 985 | 0.1% | |
| Visible minority, n.i.e. | 970 | 0.1% | |
| Multiple visible minorities | 2,750 | 0.3% | |
| Total visible minority population | 93,430 | 9.8% | |
| Indigenous group | First Nations (North American Indian) | 28,050 | 2.9% |
| Métis | 21,090 | 2.2% | |
| Inuk (Inuit) | 1,100 | 0.1% | |
| Multiple Indigenous responses | 885 | 0.1% | |
| Indigenous responses n.i.e. | 1,300 | 0.1% | |
| Total Indigenous population | 52,430 | 5.5% | |
| Total population | 955,855 | 100.0% | |
Language
Knowledge of languages
The question on knowledge of languages allows for multiple responses. The following figures are from the 2021 Canadian Census and the 2016 Canadian Census, and lists languages that were selected by at least 0.5 per cent of respondents.
| Language | 2021[11] | 2016 | ||
|---|---|---|---|---|
| Pop. | % | Pop. | % | |
| English | 951,945 | 99.59% | 905,020 | 99.63% |
| French | 99,300 | 10.39% | 95,740 | 10.54% |
| Arabic | 11,745 | 1.23% | 9,685 | 1.07% |
| Hindi | 10,115 | 1.06% | N/A | <0.5% |
| Spanish | 8,675 | 0.91% | 6,990 | 0.77% |
| Mandarin | 8,525 | 0.89% | 5,435 | 0.6% |
| Punjabi | 6,730 | 0.7% | N/A | <0.5% |
| German | 6,665 | 0.7% | 6,335 | 0.7% |
| Miꞌkmaq | 5,650 | 0.59% | 5,540 | 0.61% |
| Tagalog | 5,595 | 0.59% | N/A | <0.5% |
Mother tongue

The 2011 Canadian census showed a population of 921,727.
Of the 904,285 singular responses to the census question concerning mother tongue the most commonly reported languages were:
| Ranking | Language | Population | Percentage |
|---|---|---|---|
| 1. | English | 836,085 | 92.46% |
| 2. | French | 31,105 | 3.44% |
| 3. | Arabic | 5,965 | 0.66% |
| 4. | Algonquian languages | 4,685 | 0.52% |
| Mi'kmaq | 4,620 | 0.51% | |
| 5. | German | 3,275 | 0.36% |
| 6. | Chinese | 2,750 | 0.30% |
| Mandarin | 905 | 0.10% | |
| Cantonese | 590 | 0.06% | |
| 7. | Dutch | 1,725 | 0.19% |
| 8. | Spanish | 1,545 | 0.17% |
| 9. | Canadian Gaelic | 1,275 | 0.14% |
| =10. | Tagalog | 1.185 | 0.13% |
| =10. | Persian | 1,185 | 0.13% |
| 11. | Polish | 825 | 0.09% |
| =12. | Korean | 815 | 0.09% |
| =12. | Russian | 815 | 0.09% |
| 14. | Italian | 790 | 0.09% |
| 15. | Greek | 775 | 0.08% |
| 16. | Scandinavian languages | 595 | 0.06% |
| Danish | 175 | 0.02% | |
| Norwegian | 125 | 0.02% | |
| Icelandic | 120 | 0.01% | |
| Swedish | 85 | 0.01% | |
| 17. | Urdu | 540 | 0.06% |
| 18. | Serbo-Croatian languages | 520 | 0.06% |
| Croatian | 210 | 0.02% | |
| Serbo-Croatian | 105 | 0.01% | |
| Bosnian | 90 | 0.01% | |
| Serbian | 115 | 0.01% | |
| 19. | Hindi | 515 | 0.06% |
| 20. | Vietnamese | 450 | 0.05% |
| 21. | Portuguese | 380 | 0.04% |
| 22. | Bengali | 375 | 0.04% |
| 23. | Panjabi | 370 | 0.04% |
| 24. | Celtic languages | 330 | 0.04% |
| 25. | Japanese | 305 | 0.03% |
| 26. | Ukrainian | 300 | 0.03% |
| 27. | Hungarian | 280 | 0.03% |
| 28. | Czech | 180 | 0.02% |
| 29. | Romanian | 170 | 0.02% |
| 30. | Gujarati | 105 | 0.01% |
There were also 275 single-language responses for Turkish; 195 for Non-verbal languages (Sign languages); 30 for Malay; 100 for Bantu languages; 70 for Kurdish; 120 for Slovak; and 5 for Estonian. Figures shown are for the number of single language responses and the percentage of total single-language responses.[12]
Religion

| Religious group | 2021[13] | 2011[14] | 2001[15] | 1991[16] | 1981[17] | |||||
|---|---|---|---|---|---|---|---|---|---|---|
| Pop. | % | Pop. | % | Pop. | % | Pop. | % | Pop. | % | |
| Christianity |
556,115 | 58.18% | 690,460 | 76.19% | 780,530 | 86.96% | 815,815 | 91.57% | 800,325 | 95.3% |
| Irreligion | 359,395 | 37.6% | 197,665 | 21.81% | 106,405 | 11.85% | 68,010 | 7.63% | 34,335 | 4.09% |
| Islam |
14,715 | 1.54% | 8,505 | 0.94% | 3,545 | 0.39% | 1,435 | 0.16% | 790 | 0.09% |
| Hinduism |
8,460 | 0.89% | 1,850 | 0.2% | 1,235 | 0.14% | 970 | 0.11% | 1,025 | 0.12% |
| Sikhism |
4,735 | 0.5% | 390 | 0.04% | 270 | 0.03% | 330 | 0.04% | 275 | 0.03% |
| Buddhism |
2,955 | 0.31% | 2,205 | 0.24% | 1,735 | 0.19% | 1,485 | 0.17% | 420 | 0.05% |
| Judaism |
2,195 | 0.23% | 1,805 | 0.2% | 2,120 | 0.24% | 1,950 | 0.22% | 2,010 | 0.24% |
| Indigenous spirituality | 1,090 | 0.11% | 570 | 0.06% | — | — | — | — | — | — |
| Other | 6,195 | 0.65% | 2,720 | 0.3% | 1,720 | 0.19% | 960 | 0.11% | 525 | 0.06% |
| Total responses | 955,855 | 98.6% | 906,175 | 98.31% | 897,570 | 98.85% | 890,950 | 99% | 839,800 | 99.1% |
| Total population | 969,383 | 100% | 921,727 | 100% | 908,007 | 100% | 899,942 | 100% | 847,442 | 100% |
Migration
Immigration
| Year | Immigrant percentage | Immigrant population | Total population |
|---|---|---|---|
| 1861 | 10.9% | 36,151 | 330,857 |
| 1881 | 6.3% | 27,713 | 440,572 |
| 1891 | 5.8% | 26,315 | 450,396 |
| 1901 | 5.3% | 24,402 | 459,574 |
| 1911 | 7.4% | 36,375 | 492,338 |
| 1921 | 8.3% | 43,505 | 523,837 |
| 1931 | 8.2% | 41,797 | 512,846 |
| 1941 | 7% | 40,741 | 577,962 |
| 1951 | 4.5% | 28,680 | 642,584 |
| 1961 | 4.6% | 34,168 | 737,007 |
| 1971 | 4.7% | 37,190 | 788,960 |
The 2021 census reported that immigrants (individuals born outside Canada) comprise 71,570 persons or 7.5 percent of the total population of Nova Scotia.[21]
| Country of Birth | 2021[22][21] | 2016[23] | 2011[24][25] | 2006[26][27] | 2001[28][29] | |||||
|---|---|---|---|---|---|---|---|---|---|---|
| Pop. | % | Pop. | % | Pop. | % | Pop. | % | Pop. | % | |
| United Kingdom | 11,930 | 16.7% | 11,270 | 20.2% | 11,000 | 22.8% | 11,660 | 25.8% | 10,800 | 26.1% |
| United States | 7,570 | 10.6% | 7,375 | 13.2% | 8,275 | 17.1% | 7,960 | 17.6% | 8,065 | 19.5% |
| India | 5,605 | 7.8% | 2,225 | 4% | 1,415 | 2.9% | 1,440 | 3.2% | 1,140 | 2.8% |
| Philippines | 4,755 | 6.6% | 2,575 | 4.6% | 1,325 | 2.7% | 420 | 0.9% | 495 | 1.2% |
| China | 4,320 | 6% | 2,830 | 5.1% | 1,710 | 3.5% | 1,740 | 3.9% | 1,025 | 2.5% |
| Syria | 2,420 | 3.4% | 1,150 | 2.1% | 185 | 0.4% | 135 | 0.3% | 180 | 0.4% |
| Germany | 2,375 | 3.3% | 2,600 | 4.7% | 2,385 | 4.9% | 2,850 | 6.3% | 2,455 | 5.9% |
| Nigeria | 1,745 | 2.4% | 350 | 0.6% | 215 | 0.4% | 165 | 0.4% | 105 | 0.3% |
| Lebanon | 1,565 | 2.2% | 1,365 | 2.5% | 1,590 | 3.3% | 1,265 | 2.8% | 1,460 | 3.5% |
| Netherlands | 1,465 | 2% | 1,645 | 3% | 1,530 | 3.2% | 1,830 | 4% | 1,975 | 4.8% |
| Total immigrants | 71,570 | 7.5% | 55,680 | 6.1% | 48,275 | 5.3% | 45,190 | 5% | 41,315 | 4.6% |
| Total responses | 955,855 | 98.6% | 908,340 | 98.3% | 906,175 | 98.3% | 903,090 | 98.9% | 897,570 | 98.9% |
| Total population | 969,383 | 100% | 923,598 | 100% | 921,727 | 100% | 913,462 | 100% | 908,007 | 100% |
Recent immigration
The 2021 Canadian census counted a total of 21,385 people who immigrated to Nova Scotia between 2016 and 2021.[21]
| Recent immigrants to Nova Scotia by Country of birth (2016 to 2021)[21] | |||
|---|---|---|---|
| Country of Birth | Population | % recent immigrants | |
| India | 3,665 | 17.1% | |
| Philippines | 2,325 | 10.9% | |
| Syria | 2,140 | 10% | |
| China | 2,045 | 9.6% | |
| Nigeria | 1,445 | 6.8% | |
| United States | 880 | 4.1% | |
| United Kingdom | 730 | 3.4% | |
| South Korea | 580 | 2.7% | |
| Pakistan | 375 | 1.8% | |
| Egypt | 375 | 1.8% | |
| Total | 21,385 | 100% | |
Interprovincial migration

From 1971 to 2011, Nova Scotia had a persistent negative trend in net interprovincial migration. Combined with a declining birth rate, this posed a significant demographic challenge for the province, as its population was projected to decline. The destination for Nova Scotia migrants was most often Ontario, until the turn of the 21st century when Alberta became a more popular destination; New Brunswick ranks as a distant third.[30]
| In-migrants | Out-migrants | Net migration | |
|---|---|---|---|
| 2008–09 | 15,467 | 16,218 | −751 |
| 2009–10 | 15,172 | 14,560 | 612 |
| 2010–11 | 14,553 | 14,594 | −41 |
| 2011–12 | 14,410 | 17,276 | −2,866 |
| 2012–13 | 12,630 | 16,147 | −3,517 |
| 2013–14 | 13,402 | 15,973 | −2,571 |
| 2014–15 | 13,854 | 16,165 | −2,311 |
| 2015–16 | 15,107 | 14,353 | 754 |
| 2016–17 | 15,339 | 12,500 | 2,839 |
| 2017–18 | 15,509 | 12,461 | 3,048 |
| 2018–19 | 17,324 | 14,018 | 3,306 |
Source: Statistics Canada
Employment
As of February 2019, the unemployment rate for the province is 6.4 percent. Halifax Regional Municipality 4.9 percent[31]
Income
Notes
- ↑ Statistic includes all persons that did not make up part of a visible minority or an Indigenous identity.
|
See also
References
- ↑ "Census Profile, 2021 Census of Population Profile table". Statistics Canada. 6 December 2022. Retrieved 2 January 2023.
- ↑ Belshaw, John Douglas (2015). "10.2 Demographics". Canadian History: Pre-Confederation. BCCampus.
- ↑ Canada's population Archived November 4, 2008, at the Wayback Machine. Statistics Canada. Last accessed September 28, 2006.
- ↑ Population urban and rural, by province and territory (Nova Scotia) Archived 2006-11-21 at the Wayback Machine. Statistics Canada, 2005.
- ↑ Population and dwelling counts, for Canada, provinces and territories, and population centres, 2011 and 2006 censuses: Nova Scotia Archived 2016-03-04 at the Wayback Machine. Statistics Canada.
- 1 2 3 4 5 6 7 8 "Population and dwelling counts: Canada and population centres". Statistics Canada. February 9, 2022. Retrieved February 11, 2022.
- "Population and dwelling counts: Canada, provinces and territories, and census subdivisions (municipalities), 2021 and 2016 censuses (Nova Scotia)". Statistics Canada. July 8, 2023. Retrieved July 8, 2023.
- ↑ "Decision NSUARB-MB-10-2" (PDF). Nova Scotia Utility and Review Board. January 19, 2012. Retrieved January 29, 2013.
- ↑ Canada, Government of Canada, Statistics. "Census Profile, 2016 Census, Nova Scotiat". 12.statcan.gc.ca. Retrieved 30 December 2019.
{{cite web}}: CS1 maint: multiple names: authors list (link) - ↑ Government of Canada, Statistics Canada (2022-10-26). "Census Profile, 2021 Census of Population". www12.statcan.gc.ca. Retrieved 2023-07-04.
- ↑ Government of Canada, Statistics Canada (2022-08-17). "Census Profile, 2021 Census of Population Profile table Nova Scotia [Province]". www12.statcan.gc.ca. Retrieved 2022-08-17.
- ↑ Canada, Government of Canada, Statistics (8 February 2012). "Statistics Canada: 2011 Census Profile". www12.statcan.gc.ca. Archived from the original on 2018-05-27.
{{cite web}}: CS1 maint: multiple names: authors list (link) - ↑ Government of Canada, Statistics Canada (2022-10-26). "Census Profile, 2021 Census of Population". www12.statcan.gc.ca. Retrieved 2023-04-22.
- ↑ Government of Canada, Statistics Canada (2015-11-27). "NHS Profile". www12.statcan.gc.ca. Retrieved 2023-04-22.
- ↑ Government of Canada, Statistics Canada (2019-07-02). "2001 Community Profiles". www12.statcan.gc.ca. Retrieved 2023-04-22.
- ↑ Government of Canada, Statistics Canada (2019-03-29). "Data tables, 1991 Census R9101 - Population by Religion (29), Showing Age Groups (13) Education (20% Data) - Canada, provinces and territories, census divisions and census subdivisions". www12.statcan.gc.ca. Retrieved 2023-04-22.
- ↑ Government of Canada, Statistics Canada (2013-04-03). "1981 Census of Canada 20 per cent data base : highlight information on ethnicity, place of birth, citizenship, income, language, immigration, religion, shelter costs". www12.statcan.gc.ca. Retrieved 2023-04-22.
- ↑ Government of Canada, Statistics Canada (2013-04-03). "Report of the Secretary of the Board of Statistics on the census of Nova Scotia, 1861 ". www12.statcan.gc.ca. Retrieved 2023-12-03.
- ↑ Government of Canada, Statistics Canada (2013-04-03). "Sixth census of Canada,1921 . Vol. II: Ages, conjugal condition, birthplace, birthplace of parents, year of immigration and naturalization, language spoken, literacy, school attendance, blindness and deaf-mutism". www12.statcan.gc.ca. Retrieved 2023-01-10.
- ↑ Government of Canada, Statistics Canada (4 September 2022). "1971 Census of Canada : population : vol. I – part 3 = Recensement du Canada 1971 : population : vol. I – partie 3. Birthplace. TABLE 42. Population Bom Outside Canada, Showing Numerical and Percentage Distribution, for Canada and Provinces, 1921-1971". www12.statcan.gc.ca. Retrieved 2023-01-10.
- 1 2 3 4 Government of Canada, Statistics Canada (2022-10-26). "Census Profile, 2021 Census of Population". www12.statcan.gc.ca. Retrieved 2022-12-04.
- ↑ Government of Canada, Statistics Canada (2023-06-21). "Place of birth and period of immigration by gender and age: Province or territory". www12.statcan.gc.ca. Retrieved 2023-10-15.
- ↑ Government of Canada, Statistics Canada (2019-06-17). "Data tables, 2016 Census Immigrant Status and Period of Immigration (11), Place of Birth (272), Age (7A) and Sex (3) for the Population in Private Households of Canada, Provinces and Territories, Census Divisions and Census Subdivisions, 2016 Census - 25% Sample Data". www12.statcan.gc.ca. Retrieved 2023-03-04.
- ↑ Government of Canada, Statistics Canada (2019-01-23). "2011 National Household Survey: Data tables Profile - Immigration and Ethnocultural Diversity, and Aboriginal Peoples for Canada, Provinces, Territories, Census Divisions and Census Subdivisions, National Household Survey, 2011". www12.statcan.gc.ca. Retrieved 2023-03-04.
- ↑ Government of Canada, Statistics Canada (2019-01-23). "2011 National Household Survey: Data tables Citizenship (5), Place of Birth (236), Immigrant Status and Period of Immigration (11), Age Groups (10) and Sex (3) for the Population in Private Households of Canada, Provinces, Territories, Census Metropolitan Areas and Census Agglomerations, 2011 National Household Survey". www12.statcan.gc.ca. Retrieved 2023-11-11.
- ↑ Government of Canada, Statistics Canada (2009-03-23). "Place of birth for the immigrant population by period of immigration, 2006 counts and percentage distribution, for Canada, provinces and territories - 20% sample data". www12.statcan.gc.ca. Retrieved 2023-03-04.
- ↑ Government of Canada, Statistics Canada (2020-05-01). "2006 Census Topic-based tabulations Immigrant Status and Period of Immigration (8) and Place of Birth (261) for the Immigrants and Non-permanent Residents of Canada, Provinces, Territories, Census Metropolitan Areas and Census Agglomerations, 2006 Census - 20% Sample Data". www12.statcan.gc.ca. Retrieved 2023-03-04.
- ↑ Government of Canada, Statistics Canada (2013-12-23). "2001 Census Topic-based tabulations Immigrant Status and Period of Immigration (10A) and Place of Birth of Respondent (260) for Immigrants and Non-permanent Residents, for Canada, Provinces, Territories, Census Metropolitan Areas and Census Agglomerations, 2001 Census - 20% Sample Data". www12.statcan.gc.ca. Retrieved 2023-03-04.
- ↑ Government of Canada, Statistics Canada (2013-12-23). "2001 Census Topic-based tabulations Selected Places of Birth (85) for the Immigrant Population, for Canada, Provinces, Territories, Census Metropolitan Areas and Census Agglomerations, 1996 and 2001 Censuses - 20% Sample Data". www12.statcan.gc.ca. Retrieved 2023-03-04.
- ↑ Rashti, Amir Ahmadi; Koops, Adrian; Covey, Spencer (Spring 2015). "The Effects of Capital on Interprovincial Migration: A Nova Scotia Focused Assessment". Dalhousie Journal of Interdisciplinary Management. 11: 28.
- ↑ "Labour force characteristics by province, monthly, seasonally adjusted". 5 August 2022. Unemployment rate
- 1 2 National Household Survey (NHS) Profile - Select from a List Archived 2014-05-12 at the Wayback Machine Statistics Canada
Subdivisions of Nova Scotia | |
|---|---|
| Counties | |
| County municipalities | |
| Regional municipalities | |
| District municipalities | |
| Towns | |
| Villages | |
| Economic regions | |
| Lists | |
| |