| |||||||||||||||||||||||||||||||||||||||||||||||||||||||||||||
All 150 seats in the House of Representatives 76 seats needed for a majority | |||||||||||||||||||||||||||||||||||||||||||||||||||||||||||||
| Turnout | 87.0% ( | ||||||||||||||||||||||||||||||||||||||||||||||||||||||||||||
|---|---|---|---|---|---|---|---|---|---|---|---|---|---|---|---|---|---|---|---|---|---|---|---|---|---|---|---|---|---|---|---|---|---|---|---|---|---|---|---|---|---|---|---|---|---|---|---|---|---|---|---|---|---|---|---|---|---|---|---|---|---|
This lists parties that won seats. See the complete results below.
| |||||||||||||||||||||||||||||||||||||||||||||||||||||||||||||
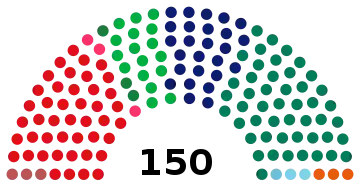
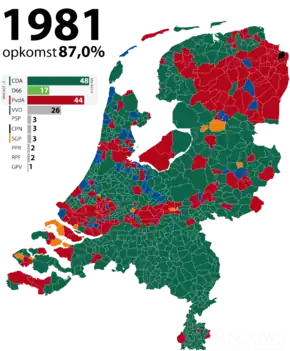
General elections were held in the Netherlands on 26 May 1981.[1][2] The Christian Democratic Appeal (CDA) emerged as the largest party, winning 48 of the 150 seats in the House of Representatives.[3]
The incumbent Christian Democratic Appeal-People's Party for Freedom and Democracy coalition lost its overall majority leading to a new coalition being formed between the CDA, the Labour Party (PvdA) and Democrats 66, with the CDA's Dries van Agt continuing as Prime Minister. However due to disagreements between the CDA and PvdA on government spending the coalition collapsed after just a year, leading to fresh elections.
Results
 | |||||
|---|---|---|---|---|---|
| Party | Votes | % | Seats | +/– | |
| Christian Democratic Appeal | 2,677,259 | 30.81 | 48 | –1 | |
| Labour Party | 2,458,452 | 28.29 | 44 | –9 | |
| People's Party for Freedom and Democracy | 1,505,311 | 17.32 | 26 | –2 | |
| Democrats 66 | 961,121 | 11.06 | 17 | +9 | |
| Pacifist Socialist Party | 184,422 | 2.12 | 3 | +2 | |
| Communist Party of the Netherlands | 178,292 | 2.05 | 3 | +1 | |
| Reformed Political Party | 171,324 | 1.97 | 3 | 0 | |
| Political Party of Radicals | 171,042 | 1.97 | 3 | 0 | |
| Reformatory Political Federation | 108,364 | 1.25 | 2 | +2 | |
| Reformed Political League | 70,878 | 0.82 | 1 | 0 | |
| Democratic Socialists '70 | 48,568 | 0.56 | 0 | –1 | |
| Evangelical People's Party | 45,189 | 0.52 | 0 | New | |
| Socialist Party | 30,380 | 0.35 | 0 | 0 | |
| Roman Catholic Party of the Netherlands | 20,812 | 0.24 | 0 | 0 | |
| Rightist People's Party | 17,371 | 0.20 | 0 | –1 | |
| Centre Party | 12,242 | 0.14 | 0 | New | |
| Dutch People's Union | 10,641 | 0.12 | 0 | 0 | |
| Liveable Netherlands | 8,336 | 0.10 | 0 | New | |
| Survive Together or Die | 3,377 | 0.04 | 0 | New | |
| Realists '81 | 2,080 | 0.02 | 0 | New | |
| International Communist League | 1,814 | 0.02 | 0 | New | |
| God with Us | 918 | 0.01 | 0 | New | |
| Wereld Welzijn Bewustwording | 891 | 0.01 | 0 | New | |
| Party for the Liquidation of the Netherlands | 826 | 0.01 | 0 | New | |
| The Peace Party | 464 | 0.01 | 0 | New | |
| Partij Van Rijksgenoten | 207 | 0.00 | 0 | New | |
| Small Party | 186 | 0.00 | 0 | New | |
| Dutch Evolution Party | 70 | 0.00 | 0 | New | |
| Total | 8,690,837 | 100.00 | 150 | 0 | |
| Valid votes | 8,690,837 | 99.46 | |||
| Invalid/blank votes | 47,401 | 0.54 | |||
| Total votes | 8,738,238 | 100.00 | |||
| Registered voters/turnout | 10,040,121 | 87.03 | |||
| Source: Kiesraad | |||||
By province
| Province | CDA | PvdA | VVD | D'66 | PSP | CPN | SGP | PPR | RPF | GPV | Others |
|---|---|---|---|---|---|---|---|---|---|---|---|
| 24.8 | 38.6 | 17.8 | 9.3 | 1.3 | 1.3 | 0.3 | 1.6 | 1.5 | 1.6 | 1.9 | |
| 33.2 | 33.2 | 12.7 | 9.5 | 1.7 | 1.7 | 0.8 | 1.8 | 2.1 | 1.4 | 1.9 | |
| 34.4 | 26.1 | 16.6 | 10.2 | 2.1 | 0.8 | 3.4 | 2.1 | 1.7 | 0.5 | 2.1 | |
| 21.4 | 39.3 | 13.4 | 8.8 | 2.6 | 4.1 | 0.2 | 2.2 | 1.7 | 3.7 | 2.6 | |
| 43.4 | 25.3 | 12.6 | 11.2 | 1.6 | 1.1 | 0.1 | 1.9 | 0.1 | 0.1 | 2.6 | |
| 42.7 | 23.6 | 14.5 | 11.2 | 1.9 | 0.9 | 0.5 | 1.9 | 0.3 | 0.1 | 2.4 | |
| 22.7 | 28.4 | 21.3 | 12.4 | 3.5 | 5.3 | 0.4 | 2.4 | 0.8 | 0.3 | 2.5 | |
| 37.8 | 26.8 | 13.2 | 9.2 | 1.2 | 1.1 | 2.8 | 1.5 | 2.4 | 2.1 | 1.9 | |
| 23.7 | 31.2 | 19.8 | 12.0 | 1.9 | 1.9 | 3.5 | 1.7 | 1.8 | 1.6 | 0.9 | |
| 20.8 | 30.8 | 18.9 | 14.6 | 1.7 | 4.6 | 0.6 | 2.4 | 1.5 | 1.0 | 3.1 | |
| 28.9 | 22.6 | 21.9 | 11.4 | 2.5 | 1.4 | 3.0 | 2.5 | 1.8 | 1.4 | 2.6 | |
| 29.5 | 27.2 | 17.0 | 9.9 | 1.1 | 0.7 | 8.0 | 1.8 | 1.9 | 1.2 | 1.7 |
References
- ↑ Dieter Nohlen & Philip Stöver (2010) Elections in Europe: A data handbook, p1396 ISBN 978-3-8329-5609-7
- ↑ van Mierlo, Hans J. G. A. (1981). "The 1981 Netherlands election". West European Politics. 4 (3): 297–301. doi:10.1080/01402388108424339. ISSN 0140-2382.
- ↑ Nohlen & Stöver, p1414
- ↑ "Tweede Kamer 26 mei 1981". Kiesraad (in Dutch). Retrieved 4 November 2021.
This article is issued from Wikipedia. The text is licensed under Creative Commons - Attribution - Sharealike. Additional terms may apply for the media files.
