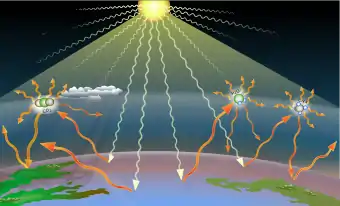
Greenhouse gases are the gases in the atmosphere that raise the surface temperature of planets such as the Earth. What distinguishes them from other gases is that they absorb the wavelengths of radiation that a planet emits, resulting in the greenhouse effect.[1] The Earth is warmed by sunlight, causing its surface to radiate heat, which is then mostly absorbed by water vapor (H2O), carbon dioxide (CO2), methane (CH4), nitrous oxide (N2O), and ozone (O3). Without greenhouse gases, the average temperature of Earth's surface would be about −18 °C (0 °F),[2] rather than the present average of 15 °C (59 °F).[3][4][5]

Human activities since the beginning of the Industrial Revolution (around 1750) have increased atmospheric methane concentrations by over 150% and carbon dioxide by over 50%,[6][7] up to a level not seen in over 3 million years.[8] Carbon dioxide is causing about three quarters of global warming and can take thousands of years to be fully absorbed by the carbon cycle.[9][10] Methane causes most of the remaining warming and lasts in the atmosphere for an average of 12 years.[11]
The vast majority of carbon dioxide emissions by humans come from the combustion of fossil fuels, principally coal, petroleum (including oil) and natural gas. Additional contributions come from cement manufacturing, fertilizer production, and changes in land use like deforestation.[12][13][14] Methane emissions originate from agriculture, fossil fuel production, waste, and other sources.[15]
According to Berkeley Earth, average global surface temperature has risen by more than 1.2 °C (2.2 °F) since the pre-industrial (1850–1899) period as a result of greenhouse gas emissions. If current emission rates continue then temperature rises will surpass 2.0 °C (3.6 °F) sometime between 2040 and 2070, which is the level the United Nations' Intergovernmental Panel on Climate Change (IPCC) says is "dangerous".[16]
Definition
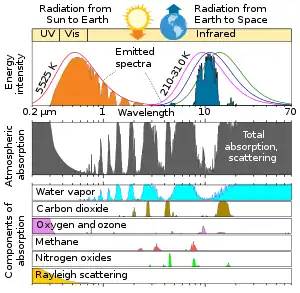
Greenhouse gases are infrared active gases that absorb and emit infrared radiation in the wavelength range emitted by Earth.[17]: 2233 Carbon dioxide (0.04%), nitrous oxide, methane, and ozone are trace gases that account for almost 0.1% of Earth's atmosphere and have an appreciable greenhouse effect.
A formal definition of greenhouses gases is as follows: "Gaseous constituents of the atmosphere, both natural and anthropogenic, that absorb and emit radiation at specific wavelengths within the spectrum of radiation emitted by the Earth's surface, by the atmosphere itself, and by clouds. This property causes the greenhouse effect."[17]: 2233 The radiation emitted by the Earth's surface, the atmosphere and clouds is called thermal infrared or longwave radiation.[17]: 2251
List of most abundant greenhouse gases
The most abundant greenhouse gases in Earth's atmosphere, listed in decreasing order of average global mole fraction, are:[18][19]
- Water vapor (H
2O) - Carbon dioxide (CO
2) - Methane (CH
4) - Nitrous oxide (N
2O) - Ozone (O
3) - Chlorofluorocarbons (CFCs and HCFCs)
- Hydrofluorocarbons (HFCs)
- Perfluorocarbons (CF
4, C
2F
6, etc.), SF
6, and NF
3
Water vapor is a potent greenhouse gas but not one that humans are directly adding to.[20] It is therefore not one of the drivers of climate change that the IPCC (Intergovernmental Panel on Climate Change) is concerned with, and therefore not included in the IPCC list of greenhouse gases. Changes in water vapor is a feedback that impacts climate sensitivity in complicated ways (because of clouds mostly).
Properties
Most gases whose molecules have two different atoms (such as carbon monoxide, CO), and all gasses with three or more atoms (including H2O and CO2), are infrared active and act as greenhouse gases. Technically, this is because an asymmetry in the molecule's electric charge distribution allows molecular vibrations to interact with electromagnetic radiation.[21]
Gasses with only one atom (such as argon, Ar) or with two identical atoms (such as nitrogen, N
2, and oxygen, O
2) are not infrared active. They are transparent to thermal radiation, and, for practical purposes, do not absorb or emit thermal radiation.
This is because monatomic gases such as Ar do not have vibrational modes, and molecules containing two atoms of the same element such as N
2 and O
2 have no asymmetry in the distribution of their electrical charges when they vibrate.[21] Hence they are almost totally unaffected by infrared thermal radiation.[22] N
2 and O
2 are able to absorb and emit very small amounts of infrared thermal radiation as a result of collision-induced absorption. However, even taking relative abundances into account, this effect is small compared to the influences of Earth's major greenhouse gases.[23]
The major constituents of Earth's atmosphere, nitrogen (N
2) (78%), oxygen (O
2) (21%), and argon (Ar) (0.9%), are not infrared active and so are not greenhouse gases. These gases make up more than 99% of the dry atmosphere.[17]
Global warming potential (GWP) and CO2 equivalents
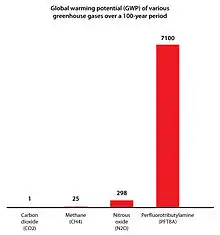
Global warming potential (GWP) is an index to measure of how much infrared thermal radiation a greenhouse gas would absorb over a given time frame after it has been added to the atmosphere (or emitted to the atmosphere). The GWP makes different greenhouse gases comparable with regards to their "effectiveness in causing radiative forcing".[24]: 2232 It is expressed as a multiple of the radiation that would be absorbed by the same mass of added carbon dioxide (CO2), which is taken as a reference gas. Therefore, the GWP is one for CO2. For other gases it depends on how strongly the gas absorbs infrared thermal radiation, how quickly the gas leaves the atmosphere, and the time frame being considered.
For example, methane has a GWP over 20 years (GWP-20) of 81.2[25] meaning that, for example, a leak of a tonne of methane is equivalent to emitting 81.2 tonnes of carbon dioxide measured over 20 years. As methane has a much shorter atmospheric lifetime than carbon dioxide, its GWP is much less over longer time periods, with a GWP-100 of 27.9 and a GWP-500 of 7.95.[25]: 7SM-24
The carbon dioxide equivalent (CO2e or CO2eq or CO2-e) can be calculated from the GWP. For any gas, it is the mass of CO2 that would warm the earth as much as the mass of that gas. Thus it provides a common scale for measuring the climate effects of different gases. It is calculated as GWP times mass of the other gas.Sources
Natural sources
Most greenhouse gases have both natural and human-caused sources. An exception are purely human-produced synthetic halocarbons which have no natural sources. During the pre-industrial Holocene, concentrations of existing gases were roughly constant, because the large natural sources and sinks roughly balanced. In the industrial era, human activities have added greenhouse gases to the atmosphere, mainly through the burning of fossil fuels and clearing of forests.[26][27]
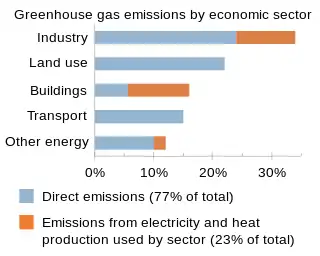
Greenhouse gas emissions from human activities
The major anthropogenic (human origin) sources of greenhouse gases are carbon dioxide (CO2), nitrous oxide (N
2O), methane, three groups of fluorinated gases (sulfur hexafluoride (SF
6), hydrofluorocarbons (HFCs) and perfluorocarbons (PFCs, sulphur hexafluoride (SF6), and nitrogen trifluoride (NF3)).[28] Though the greenhouse effect is heavily driven by water vapor,[29] human emissions of water vapor are not a significant contributor to warming.
Water vapor

Water vapor accounts for the largest percentage of the greenhouse effect, between 36% and 66% for clear sky conditions and between 66% and 85% when including clouds.[35] Water vapor concentrations fluctuate regionally, but human activity does not directly affect water vapor concentrations except at local scales, such as near irrigated fields. Indirectly, human activity that increases global temperatures will increase water vapor concentrations, a process known as water vapor feedback.[36] The atmospheric concentration of vapor is highly variable and depends largely on temperature, from less than 0.01% in extremely cold regions up to 3% by mass in saturated air at about 32 °C.[37] (See Relative humidity#Other important facts.)
The average residence time of a water molecule in the atmosphere is only about nine days, compared to years or centuries for other greenhouse gases such as CH
4 and CO2.[38] Water vapor responds to and amplifies effects of the other greenhouse gases. The Clausius–Clapeyron relation establishes that more water vapor will be present per unit volume at elevated temperatures. This and other basic principles indicate that warming associated with increased concentrations of the other greenhouse gases also will increase the concentration of water vapor (assuming that the relative humidity remains approximately constant; modeling and observational studies find that this is indeed so). Because water vapor is a greenhouse gas, this results in further warming and so is a "positive feedback" that amplifies the original warming. Current estimates (as of 2000) suggest that water vapor feedback has a "gain" coefficient of about 0.4; a gain coefficient must be 1 or greater to create an unstable feedback loop of the sort that could stimulate runaway warming. Thus, although water vapor feedback amplifies the impact of temperature changes caused by other factors, there is no indication that Earth is involved in a runaway greenhouse effect of the sort that could lead to Venus-like conditions.[36]
Role in radiative forcing and greenhouse effect
Effects on air and surface
Absorption and emission of thermal radiation by greenhouse gases plays a role in heat transport in the air and at the surface:
- Atmospheric cooling: Greenhouse gases emit more thermal radiation than they absorb, and so have an overall cooling effect on air.[39]: 139 [40]
- Inhibition of radiative surface cooling: Greenhouse gases limit radiative heat flow away from the surface and within the lower atmosphere. Greenhouse gases exchange thermal radiation with the surface, reducing the overall rate of upward radiative heat transfer.[39]: 139 [40]
Naming these effects contributes to a full understanding of the role of greenhouse gases. However, these effects are of secondary importance when it comes to understanding global warming. It is important to focus on top-of-atmosphere energy balance in order to correctly reason about global warming. It has been argued that the surface budget fallacy, in which focus on the surface energy budget leads to faulty reasoning, constitutes a common fallacy when thinking about the greenhouse effect and global warming.[41]: 413
Effect at top-of-atmosphere (TOA)
At the top of the atmosphere (TOA), absorbing and emission of thermal radiation by greenhouse gases leads to inhibition of radiative cooling to space, which means the amount of thermal radiation reaching space is reduced, relative to what is emitted by the surface.[40][41] The change in TOA energy balance leads to the surface accumulating thermal energy and warming until TOA energy balance is achieved.
Radiative forcing
Radiative forcing is a metric that characterizes the impact of an external change in a factor that influences climate, e.g., a change in the concentration of greenhouse gases, or the effect of a volcanic eruption. The radiative forcing associated with a change is calculated as the change in the top-of-atmosphere (TOA) energy balance that would be caused by the external change, if one imagined that the change could be made without giving the troposphere or surface time to respond to reduce the imbalance. A positive forcing indicates more energy arriving than leaving.[17]: 2245 The term radiative forcing has been used inconsistently in the scientific literature.[42]
Increasing the concentration of greenhouse gases is associated with a positive radiative forcing. Increasing the concentration of greenhouse gases tends to increase the TOA energy imbalance, leading to additional warming.
The major non-gas contributor to Earth's greenhouse effect, clouds, also absorb and emit infrared radiation and thus have an effect on greenhouse gas radiative properties. Clouds are water droplets or ice crystals suspended in the atmosphere.[43][35]
Earth absorbs some of the radiant energy received from the sun, reflects some of it as light and reflects or radiates the rest back to space as heat. A planet's surface temperature depends on this balance between incoming and outgoing energy. When Earth's energy balance is shifted, its surface becomes warmer or cooler, leading to a variety of changes in global climate.[47]
A number of natural and human-made mechanisms can affect the global energy balance and force changes in Earth's climate. Greenhouse gases are one such mechanism. Greenhouse gases absorb and emit some of the outgoing energy radiated from Earth's surface, causing that heat to be retained in the lower atmosphere.[47] Some greenhouse gases remain in the atmosphere for decades or even centuries such as Nitrous oxide and Fluorinated gases,[48] and therefore can affect Earth's energy balance over a long period. Radiative forcing quantifies (in Watts per square meter) the effect of factors that influence Earth's energy balance; including changes in the concentrations of greenhouse gases. Positive radiative forcing leads to warming by increasing the net incoming energy, whereas negative radiative forcing leads to cooling,[49] as with anti-greenhouse effects causing gases like sulfur dioxide.
Chemical process contributions to radiative forcing
Some gases contribute indirectly to altering the TOA radiative balance through participation in chemical processes within the atmosphere.
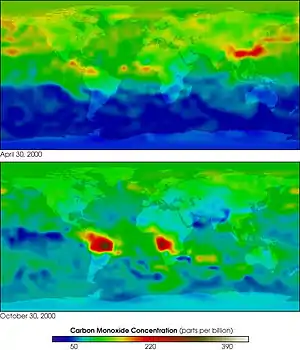
Oxidation of CO to CO2 directly produces an unambiguous increase in radiative forcing although the reason is subtle. The peak of the thermal IR emission from Earth's surface is very close to a strong vibrational absorption band of CO2 (wavelength 15 microns, or wavenumber 667 cm−1). On the other hand, the single CO vibrational band only absorbs IR at much shorter wavelengths (4.7 microns, or 2145 cm−1), where the emission of radiant energy from Earth's surface is at least a factor of ten lower. Oxidation of methane to CO2, which requires reactions with the OH radical, produces an instantaneous reduction in radiative absorption and emission since CO2 is a weaker greenhouse gas than methane. However, the oxidations of CO and CH
4 are entwined since both consume OH radicals. In any case, the calculation of the total radiative effect includes both direct and indirect forcing.
A second type of indirect effect happens when chemical reactions in the atmosphere involving these gases change the concentrations of greenhouse gases. For example, the destruction of non-methane volatile organic compounds (NMVOCs) in the atmosphere can produce ozone. The size of the indirect effect can depend strongly on where and when the gas is emitted.[51]
NMVOCs include a large variety of chemically different compounds, such as benzene, ethanol, formaldehyde, cyclohexane, 1,1,1-trichloroethane and acetone.[52] Essentially, NMVOCs are identical to volatile organic compounds (VOCs), but with methane excluded.[53] Methane is excluded in air-pollution contexts because it is not toxic. It is however a very potent greenhouse gas, with low reactivity and thus a long lifetime in the atmosphere.[54] An important subset of NMVOCs are the non-methane hydrocarbons (NMHCs). The same process that converts NMVOCs to carbon dioxide can also lead to the formation of tropospheric ozone. Halocarbons have an indirect effect because they destroy stratospheric ozone. Finally, hydrogen can lead to ozone production and CH
4 increases as well as producing stratospheric water vapor.[51][55]
Contributions of specific gases to the greenhouse effect
It is not possible to state that a certain gas causes an exact percentage of the greenhouse effect. This is because the absorption and emission bands of the gases overlap, so that the total greenhouse effect is not simply the sum of the influence of each gas. The higher ends of the ranges quoted are for each gas alone; the lower ends account for overlaps with the other gases.[43][35] In addition, some gases, such as methane, are known to have large indirect effects that are still being quantified.[57]
A water molecule only stays in the atmosphere for an average 8 to 10 days, which corresponds with high variability in the contribution from clouds and humidity at any particular time and location.[58]: 1–41
By their percentage contribution to the overall greenhouse effect on Earth, the four major greenhouse gases are:[59][60]
- Water vapor (H2O), 36~72% (~75% including clouds);[61]
- Carbon dioxide (CO2), 9~26%;
- Methane (CH4), 4~9%;
- Tropospheric ozone (O3), 3~7%.
Anthropogenic changes to the natural greenhouse effect are sometimes referred to as the enhanced greenhouse effect.[17]: 2223 The contribution of each gas to the enhanced greenhouse effect is determined by the characteristics of that gas, its abundance, and any indirect effects it may cause. For example, the direct radiative effect of a mass of methane is about 84 times stronger than the same mass of carbon dioxide over a 20-year time frame.[62]
The most important contributions to the total greenhouse effect are shown in the following table (greenhouse gases not listed explicitly below include sulfur hexafluoride, hydrofluorocarbons and perfluorocarbons (see IPCC list of greenhouse gases).).
| K&T (1997)[43] | Schmidt (2010)[42] | |||
|---|---|---|---|---|
| Contributor | Clear Sky | With Clouds | Clear Sky | With Clouds |
| Water vapor | 60 | 41 | 67 | 50 |
| Clouds | 31 | 25 | ||
| CO2 | 26 | 18 | 24 | 19 |
| Tropospheric ozone (O3) | 8 | |||
| N2O + CH4 | 6 | |||
| Other | 9 | 9 | 7 | |
|
K&T (1997) used 353 ppm CO2 and calculated 125 W/m2 total clear-sky greenhouse effect; relied on single atmospheric profile and cloud model. "With Clouds" percentages are from Schmidt (2010) interpretation of K&T (1997). | ||||
Concentrations in the atmosphere
Current concentrations compared to before the Industrial Revolution
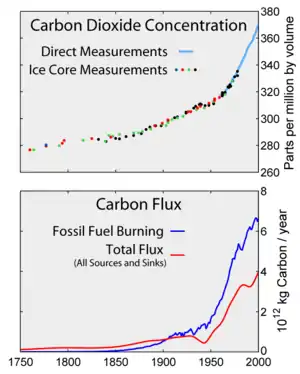
Since the beginning of the Industrial Revolution, the concentrations of many of the greenhouse gases have increased. For example, the mole fraction of carbon dioxide has increased from 280 ppm to 421 ppm, or 140 ppm over modern pre-industrial levels. The first 30 ppm increase took place in about 200 years, from the start of the Industrial Revolution to 1958; however the next 90 ppm increase took place within 56 years, from 1958 to 2014.[7][63][64]
The concentration of a greenhouse gas is typically measured in parts per million (ppm) or parts per billion (ppb) by volume. A CO2 concentration of 420 ppm means that 420 out of every million air molecules is a CO2 molecule.
Data from 2007 showed that the concentration is increasing at a higher rate. In the 1960s, the average annual increase was only 37% of what it was in 2000 through 2007.[65]
Many observations are available online in a variety of atmospheric chemistry observational satabases.
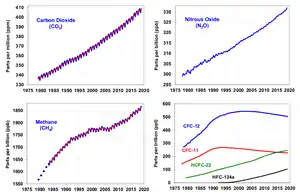
The concentrations of three important greenhouse gases changed as follows from 1750 to 2019:[66]
- Carbon dioxide (CO2), 278.3 to 409.9 ppm, up 47%;
- Methane (CH4), 729.2 to 1866.3 ppb, up 156%;
- Nitrous oxide (N2O), 270.1 to 332.1 ppb, up 23%.
Abbreviations used in the two tables below: ppm = parts-per-million; ppb = parts-per-billion; ppt = parts-per-trillion; W/m2 = watts per square meter
| Gas | Pre-1750 tropospheric concentration[68] |
Current tropospheric concentration (around 2011)[69] |
Absolute increase in 2011 since 1750 |
Percentage increase in 2011 since 1750 |
Increased radiative forcing (W/m2)[70] |
|---|---|---|---|---|---|
| Carbon dioxide (CO2) | 280 ppm[71] | 411 ppm[72] | 131 ppm | 47% | 2.05[73] |
| Methane (CH 4) | 700 ppb[74] | 1893 ppb /[75][76] 1762 ppb[75] | 1193 ppb / 1062 ppb | 170.4% / 151.7% | 0.49 |
| Nitrous oxide (N 2O) | 270 ppb[70][77] | 326 ppb /[75] 324 ppb[75] | 56 ppb / 54 ppb | 20.7% / 20.0% | 0.17 |
| Tropospheric ozone (O 3) | 237 ppb[68] | 337 ppb[68] | 100 ppb | 42% | 0.4[78] |
| Gas | Recent tropospheric concentration | Increased radiative forcing (W/m2) |
|---|---|---|
| CFC-11 (trichlorofluoromethane) (CCl 3F) | 236 ppt / 234 ppt | 0.061 |
| CFC-12 (CCl 2F 2) | 527 ppt / 527 ppt | 0.169 |
| CFC-113 (Cl 2FC-CClF 2) | 74 ppt / 74 ppt | 0.022 |
| HCFC-22 (CHClF 2) | 231 ppt / 210 ppt | 0.046 |
| HCFC-141b (CH 3CCl 2F) | 24 ppt / 21 ppt | 0.0036 |
| HCFC-142b (CH 3CClF 2) | 23 ppt / 21 ppt | 0.0042 |
| Halon 1211 (CBrClF 2) | 4.1 ppt / 4.0 ppt | 0.0012 |
| Halon 1301 (CBrF 3) | 3.3 ppt / 3.3 ppt | 0.001 |
| HFC-134a (CH 2FCF 3) | 75 ppt / 64 ppt | 0.0108 |
| Carbon tetrachloride (CCl 4) | 85 ppt / 83 ppt | 0.0143 |
| Sulfur hexafluoride (SF 6)[79][80][81] |
7.79 ppt / 7.39 ppt | 0.0043 |
| Other halocarbons | Varies by substance | collectively 0.02 |
| Halocarbons in total | 0.3574 |
Factors affecting concentrations
Atmospheric concentrations are determined by the balance between sources (emissions of the gas from human activities and natural systems) and sinks (the removal of the gas from the atmosphere by conversion to a different chemical compound or absorption by bodies of water).[82]
Airborne fraction
The proportion of an emission remaining in the atmosphere after a specified time is the "airborne fraction" (AF). The annual airborne fraction is the ratio of the atmospheric increase in a given year to that year's total emissions.
As of 2006 the annual airborne fraction for CO2 was about 0.45. The annual airborne fraction increased at a rate of 0.25 ± 0.21% per year over the period 1959–2006.[83]
Atmospheric lifetime
Aside from water vapor, which has a residence time of about nine days,[84] major greenhouse gases are well mixed and take many years to leave the atmosphere.[85] Although it is not easy to know with precision how long it takes greenhouse gases to leave the atmosphere, there are estimates for the principal greenhouse gases. Jacob (1999)[86] defines the lifetime of an atmospheric species X in a one-box model as the average time that a molecule of X remains in the box. Mathematically can be defined as the ratio of the mass (in kg) of X in the box to its removal rate, which is the sum of the flow of X out of the box (), chemical loss of X (), and deposition of X () (all in kg/s):


- .[86]

If input of this gas into the box ceased, then after time , its concentration would decrease by about 63%.
The atmospheric lifetime of a species therefore measures the time required to restore equilibrium following a sudden increase or decrease in its concentration in the atmosphere. Individual atoms or molecules may be lost or deposited to sinks such as the soil, the oceans and other waters, or vegetation and other biological systems, reducing the excess to background concentrations. The average time taken to achieve this is the mean lifetime.
Carbon dioxide has a variable atmospheric lifetime, and cannot be specified precisely.[87][62][17]: 2237 Similar issues apply to other greenhouse gases, many of which have longer mean lifetimes than CO2, e.g. N2O has a mean atmospheric lifetime of 121 years.[62]
During geologic time scales


Carbon dioxide is believed to have played an important effect in regulating Earth's temperature throughout its 4.7 billion year history. Early in the Earth's life, scientists have found evidence of liquid water indicating a warm world even though the Sun's output is believed to have only been 70% of what it is today. Higher carbon dioxide concentrations in the early Earth's atmosphere might help explain this faint young sun paradox. When Earth first formed, Earth's atmosphere may have contained more greenhouse gases and CO2 concentrations may have been higher, with estimated partial pressure as large as 1,000 kPa (10 bar), because there was no bacterial photosynthesis to reduce the gas to carbon compounds and oxygen. Methane, a very active greenhouse gas, may have been more prevalent as well.[88][89]
Carbon dioxide concentrations have shown several cycles of variation from about 180 parts per million during the deep glaciations of the Holocene and Pleistocene to 280 parts per million during the interglacial periods. Carbon dioxide concentrations have varied widely over the Earth's 4.54 billion year history. It is believed to have been present in Earth's first atmosphere, shortly after Earth's formation. The second atmosphere, consisting largely of nitrogen and CO2 was produced by outgassing from volcanism, supplemented by gases produced during the late heavy bombardment of Earth by huge asteroids.[90] A major part of carbon dioxide emissions were soon dissolved in water and incorporated in carbonate sediments.
Removal from the atmosphere
Natural processes
Carbon dioxide is removed from the atmosphere primarily through photosynthesis and enters the terrestrial and oceanic biospheres. Carbon dioxide also dissolves directly from the atmosphere into bodies of water (ocean, lakes, etc.), as well as dissolving in precipitation as raindrops fall through the atmosphere. When dissolved in water, carbon dioxide reacts with water molecules and forms carbonic acid, which contributes to ocean acidity. It can then be absorbed by rocks through weathering. It also can acidify other surfaces it touches or be washed into the ocean.[91]
Negative emissions
A number of technologies remove greenhouse gases emissions from the atmosphere. Most widely analyzed are those that remove carbon dioxide from the atmosphere, either to geologic formations such as bio-energy with carbon capture and storage and carbon dioxide air capture,[94] or to the soil as in the case with biochar.[94] Many long-term climate scenario models require large-scale human-made negative emissions to avoid serious climate change.[95] Negative emissions approaches are also being studied for atmospheric methane, called atmospheric methane removal.[96]
History

In the late 19th century, scientists experimentally discovered that N
2 and O
2 do not absorb infrared radiation (called, at that time, "dark radiation"), while water (both as true vapor and condensed in the form of microscopic droplets suspended in clouds) and CO2 and other poly-atomic gaseous molecules do absorb infrared radiation.[98][99] In the early 20th century, researchers realized that greenhouse gases in the atmosphere made Earth's overall temperature higher than it would be without them. The term greenhouse was first applied to this phenomenon by Nils Gustaf Ekholm in 1901.[100][101]
During the late 20th century, a scientific consensus evolved that increasing concentrations of greenhouse gases in the atmosphere cause a substantial rise in global temperatures and changes to other parts of the climate system,[102] with consequences for the environment and for human health.
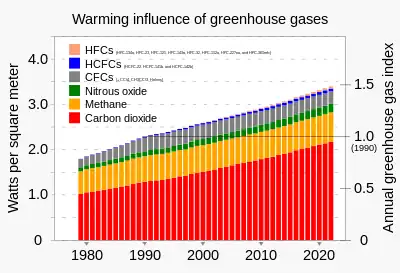
Inventories and monitoring
The Annual Greenhouse Gas Index (AGGI) is defined by atmospheric scientists at NOAA as the ratio of total direct radiative forcing due to long-lived and well-mixed greenhouse gases for any year for which adequate global measurements exist, to that present in year 1990.[46][103] These radiative forcing levels are relative to those present in year 1750 (i.e. prior to the start of the industrial era). 1990 is chosen because it is the baseline year for the Kyoto Protocol, and is the publication year of the first IPCC Scientific Assessment of Climate Change.
As such, NOAA states that the AGGI "measures the commitment that (global) society has already made to living in a changing climate. It is based on the highest quality atmospheric observations from sites around the world. Its uncertainty is very low."[104]
Data networks
Other planets
Greenhouse gases exist in many atmospheres, creating greenhouse effects on Mars, Titan and particularly in the thick atmosphere of Venus.[109]
See also
References
- ↑ Matthews, J.B.R.; Möller, V.; van Diemenn, R.; Fuglesvedt, J.R.; et al. (9 August 2021). "Annex VII: Glossary". In Masson-Delmotte, Valérie; Zhai, Panmao; Pirani, Anna; Connors, Sarah L.; Péan, Clotilde; et al. (eds.). Climate Change 2021: The Physical Science Basis. Contribution of Working Group I to the Sixth Assessment Report of the Intergovernmental Panel on Climate Change (PDF). IPCC / Cambridge University Press. pp. 2215–2256. doi:10.1017/9781009157896.022. ISBN 9781009157896.
- ↑ "NASA GISS: Science Briefs: Greenhouse Gases: Refining the Role of Carbon Dioxide". www.giss.nasa.gov. Archived from the original on 12 January 2005. Retrieved 26 April 2016.
- ↑ Karl TR, Trenberth KE (2003). "Modern global climate change". Science. 302 (5651): 1719–23. Bibcode:2003Sci...302.1719K. doi:10.1126/science.1090228. PMID 14657489. S2CID 45484084. Archived from the original on 22 April 2021. Retrieved 26 July 2019.
- ↑ Le Treut H.; Somerville R.; Cubasch U.; Ding Y.; Mauritzen C.; Mokssit A.; Peterson T.; Prather M. Historical overview of climate change science (PDF). Archived (PDF) from the original on 26 November 2018. Retrieved 14 December 2008. in IPCC AR4 WG1 (2007)
- ↑ "NASA Science Mission Directorate article on the water cycle". Nasascience.nasa.gov. Archived from the original on 17 January 2009. Retrieved 16 October 2010.
- ↑ "Understanding methane emissions". International Energy Agency.
The concentration of methane in the atmosphere is currently over two-and-a-half times greater than its pre-industrial levels
- 1 2 "Carbon dioxide now more than 50% higher than pre-industrial levels". National Oceanic and Atmospheric Administration. 3 June 2022. Retrieved 30 August 2022.
- ↑ "Climate Change: Atmospheric Carbon Dioxide". www.climate.gov. Archived from the original on 24 June 2013. Retrieved 2 March 2020.
- ↑ "Global Greenhouse Gas Emissions Data". United States Environmental Protection Agency. 12 January 2016.
- ↑ "Climate Change Indicators: Greenhouse Gases". United States Environmental Protection Agency. 16 December 2015.
Carbon dioxide's lifetime cannot be represented with a single value because the gas is not destroyed over time, but instead moves among different parts of the ocean–atmosphere–land system. Some of the excess carbon dioxide is absorbed quickly (for example, by the ocean surface), but some will remain in the atmosphere for thousands of years, due in part to the very slow process by which carbon is transferred to ocean sediments.
- ↑ "Understanding methane emissions". International Energy Agency.
- ↑ IPCC AR6 WG1 Ch5 2021, Sec 5.2.1.1
- ↑ "Global Greenhouse Gas Emissions Data". U.S. Environmental Protection Agency. 12 January 2016. Archived from the original on 5 December 2019. Retrieved 30 December 2019.
The burning of coal, natural gas, and oil for electricity and heat is the largest single source of global greenhouse gas emissions.
- ↑ "AR4 SYR Synthesis Report Summary for Policymakers – 2 Causes of change". ipcc.ch. Archived from the original on 28 February 2018. Retrieved 9 October 2015.
- ↑ "Global Methane Tracker 2023". International Energy Agency.
- ↑ "Analysis: When might the world exceed 1.5C and 2C of global warming?". Carbon Brief. 4 December 2020. Archived from the original on 6 June 2021. Retrieved 17 June 2021.
- 1 2 3 4 5 6 7 IPCC, 2021: Annex VII: Glossary [Matthews, J.B.R., V. Möller, R. van Diemen, J.S. Fuglestvedt, V. Masson-Delmotte, C. Méndez, S. Semenov, A. Reisinger (eds.)]. In Climate Change 2021: The Physical Science Basis. Contribution of Working Group I to the Sixth Assessment Report of the Intergovernmental Panel on Climate Change [Masson-Delmotte, V., P. Zhai, A. Pirani, S.L. Connors, C. Péan, S. Berger, N. Caud, Y. Chen, L. Goldfarb, M.I. Gomis, M. Huang, K. Leitzell, E. Lonnoy, J.B.R. Matthews, T.K. Maycock, T. Waterfield, O. Yelekçi, R. Yu, and B. Zhou (eds.)]. Cambridge University Press, Cambridge, United Kingdom and New York, NY, USA, pp. 2215–2256, doi:10.1017/9781009157896.022.
- ↑ "Atmospheric Concentration of Greenhouse Gases" (PDF). U.S. Environmental Protection Agency. 1 August 2016. Archived (PDF) from the original on 19 October 2021. Retrieved 6 September 2021.
- ↑ "Inside the Earth's invisible blanket". sequestration.org. Archived from the original on 28 July 2020. Retrieved 5 March 2021.
- ↑ Gavin Schmidt (1 October 2010). "Taking the Measure of the Greenhouse Effect". NASA Goddard Institute for Space Studies - Science Briefs.
- 1 2 Archer, David (2011). Global Warming: Understanding the Forecast, Chapter 4: Greenhouse Gases (PDF) (2 ed.). Wiley. ISBN 978-0470943410. Retrieved 14 June 2023.
- ↑ Wei, Peng-Sheng; Hsieh, Yin-Chih; Chiu, Hsuan-Han; Yen, Da-Lun; Lee, Chieh; Tsai, Yi-Cheng; Ting, Te-Chuan (6 October 2018). "Absorption coefficient of carbon dioxide across atmospheric troposphere layer". Heliyon. 4 (10): e00785. Bibcode:2018Heliy...400785W. doi:10.1016/j.heliyon.2018.e00785. PMC 6174548. PMID 30302408.
- ↑ Höpfner, M.; Milz, M.; Buehler, S.; Orphall, J.; Stiller, G. (24 May 2012). "The natural greenhouse effect of atmospheric oxygen (O2) and nitrogen (N2)". Geophysical Research Letters. 39 (L10706). Bibcode:2012GeoRL..3910706H. doi:10.1029/2012GL051409. ISSN 1944-8007. S2CID 128823108.
- ↑ IPCC, 2021: Annex VII: Glossary [Matthews, J.B.R., V. Möller, R. van Diemen, J.S. Fuglestvedt, V. Masson-Delmotte, C. Méndez, S. Semenov, A. Reisinger (eds.)]. In Climate Change 2021: The Physical Science Basis. Contribution of Working Group I to the Sixth Assessment Report of the Intergovernmental Panel on Climate Change [Masson-Delmotte, V., P. Zhai, A. Pirani, S.L. Connors, C. Péan, S. Berger, N. Caud, Y. Chen, L. Goldfarb, M.I. Gomis, M. Huang, K. Leitzell, E. Lonnoy, J.B.R. Matthews, T.K. Maycock, T. Waterfield, O. Yelekçi, R. Yu, and B. Zhou (eds.)]. Cambridge University Press, Cambridge, United Kingdom and New York, NY, USA, pp. 2215–2256, doi:10.1017/9781009157896.022.
- 1 2 7.SM.6 Tables of greenhouse gas lifetimes, radiative efficiencies and metrics (PDF), IPCC, 2021, p. 7SM-24.
- ↑ "Historical Overview of Climate Change Science – FAQ 1.3 Figure 1" (PDF). p. 116. Archived (PDF) from the original on 26 November 2018. Retrieved 25 April 2008. in IPCC AR4 WG1 (2007)
- ↑ "Chapter 3, IPCC Special Report on Emissions Scenarios, 2000" (PDF). Intergovernmental Panel on Climate Change. 2000. Archived (PDF) from the original on 20 August 2018. Retrieved 16 October 2010.
- ↑ Dhakal, S., J.C. Minx, F.L. Toth, A. Abdel-Aziz, M.J. Figueroa Meza, K. Hubacek, I.G.C. Jonckheere, Yong-Gun Kim, G.F. Nemet, S. Pachauri, X.C. Tan, T. Wiedmann, 2022: Chapter 2: Emissions Trends and Drivers. In IPCC, 2022: Climate Change 2022: Mitigation of Climate Change. Contribution of Working Group III to the Sixth Assessment Report of the Intergovernmental Panel on Climate Change [P.R. Shukla, J. Skea, R. Slade, A. Al Khourdajie, R. van Diemen, D. McCollum, M. Pathak, S. Some, P. Vyas, R. Fradera, M. Belkacemi, A. Hasija, G. Lisboa, S. Luz, J. Malley, (eds.)]. Cambridge University Press, Cambridge, UK and New York, NY, USA. doi: 10.1017/9781009157926.004
- ↑ "Water Vapor". earthobservatory.nasa.gov. 30 June 2023. Retrieved 16 August 2023.
- ↑ Johnston, Chris; Milman, Oliver; Vidal, John (15 October 2016). "Climate change: global deal reached to limit use of hydrofluorocarbons". The Guardian. Retrieved 21 August 2018.
- ↑ "Climate change: 'Monumental' deal to cut HFCs, fastest growing greenhouse gases". BBC News. 15 October 2016. Retrieved 15 October 2016.
- ↑ "Nations, Fighting Powerful Refrigerant That Warms Planet, Reach Landmark Deal". The New York Times. 15 October 2016. Retrieved 15 October 2016.
- ↑ Vaara, Miska (2003), Use of ozone depleting substances in laboratories, TemaNord, p. 170, ISBN 978-9289308847, archived from the original on 6 August 2011
- ↑ Montreal Protocol
- 1 2 3 "Water vapour: feedback or forcing?". RealClimate. 6 April 2005. Archived from the original on 24 June 2007. Retrieved 1 May 2006.
- 1 2 Held, Isaac M.; Soden, Brian J. (November 2000). "Water vapor feedback and global warming". Annual Review of Energy and the Environment. 25 (1): 441–475. CiteSeerX 10.1.1.22.9397. doi:10.1146/annurev.energy.25.1.441. ISSN 1056-3466.
- ↑ Evans, Kimberly Masters (2005). "The greenhouse effect and climate change". The environment: a revolution in attitudes. Detroit: Thomson Gale. ISBN 978-0787690823.
- ↑ "Inventory of U.S. Greenhouse Gas Emissions and Sinks: 1990–2010". U.S. Environmental Protection Agency. 15 April 2012. p. 1.4. Archived from the original on 30 December 2019. Retrieved 30 December 2019.
- 1 2 Wallace, J. M.; Hobbs, P. V. (2006). Atmospheric Science (2 ed.). Academic Press. ISBN 978-0-12-732951-2.
- 1 2 3 Manabe, S.; Strickler, R. F. (1964). "Thermal Equilibrium of the Atmosphere with a Convective Adjustment". J. Atmos. Sci. 21 (4): 361–385. Bibcode:1964JAtS...21..361M. doi:10.1175/1520-0469(1964)021<0361:TEOTAW>2.0.CO;2.
- 1 2 Pierrehumbert, Raymond T. (2010). Principles of Planetary Climate. Cambridge University Press. ISBN 978-0-521-86556-2.
- 1 2 Schmidt, G.A.; R. Ruedy; R.L. Miller; A.A. Lacis (2010), "The attribution of the present-day total greenhouse effect" (PDF), J. Geophys. Res., vol. 115, no. D20, pp. D20106, Bibcode:2010JGRD..11520106S, doi:10.1029/2010JD014287, archived from the original (PDF) on 22 October 2011, D20106. Web page Archived 4 June 2012 at the Wayback Machine
- 1 2 3 Kiehl, J.T.; Kevin E. Trenberth (1997). "Earth's annual global mean energy budget" (PDF). Bulletin of the American Meteorological Society. 78 (2): 197–208. Bibcode:1997BAMS...78..197K. doi:10.1175/1520-0477(1997)078<0197:EAGMEB>2.0.CO;2.
- ↑ "The NOAA Annual Greenhouse Gas Index (AGGI)". NOAA.gov. National Oceanic and Atmospheric Administration (NOAA). Spring 2023. Archived from the original on 24 May 2023.
- ↑ "Annual Greenhouse Gas Index". U.S. Global Change Research Program. Archived from the original on 21 April 2021. Retrieved 5 September 2020.
- 1 2 Butler J. and Montzka S. (2020). "The NOAA Annual Greenhouse Gas Index (AGGI)". NOAA Global Monitoring Laboratory/Earth System Research Laboratories. Archived from the original on 22 September 2013. Retrieved 5 September 2020.
- 1 2 "Climate Change Indicators in the United States - Greenhouse Gases". U.S. Environmental Protection Agency (EPA). 2016. Archived from the original on 27 August 2016. Retrieved 5 September 2020..
- ↑ "Climate Change Indicators: Greenhouse Gases". U.S. Environmental Protection Agency (EPA). 2022. Retrieved 22 October 2022.
- ↑ "Climate Change Indicators in the United States - Climate Forcing". U.S. Environmental Protection Agency (EPA). 2016. Archived from the original on 27 August 2016. Retrieved 5 September 2020. Archived 21 September 2020 at the Wayback Machine
- ↑ "The Chemistry of Earth's Atmosphere". Earth Observatory. NASA. Archived from the original on 20 September 2008.
- 1 2 Forster, P.; et al. (2007). "2.10.3 Indirect GWPs". Changes in Atmospheric Constituents and in Radiative Forcing. Contribution of Working Group I to the Fourth Assessment Report of the Intergovernmental Panel on Climate Change. Cambridge University Press. Archived from the original on 9 February 2019. Retrieved 2 December 2012.
- ↑ Nesaratnam, Suresh T.; Taherzadeh, Shahram; Barratt, Rod (2014), "Section 2: Meteorology and Air Pollutants", Air Quality Management, Chichester, UK: John Wiley & Sons, Ltd, pp. 15–98, doi:10.1002/9781118863886.ch2, ISBN 9781118863886
- ↑ "System of Registries". sor.epa.gov. US EPA.
- ↑ Koppmann, Ralf, ed. (2007). Volatile Organic Compounds in the Atmosphere. Oxford, UK: Blackwell Publishing Ltd. doi:10.1002/9780470988657. ISBN 978-0-470-98865-7.
- ↑ "Hydrogen 'twice as powerful a greenhouse gas as previously thought': UK government study". Recharge | Latest renewable energy news. 8 April 2022.
- ↑ "NASA: Climate Forcings and Global Warming". 14 January 2009. Archived from the original on 18 April 2021. Retrieved 20 April 2014.
- ↑ Isaksen, Ivar S.A.; Michael Gauss; Gunnar Myhre; Katey M. Walter Anthony; Carolyn Ruppel (20 April 2011). "Strong atmospheric chemistry feedback to climate warming from Arctic methane emissions" (PDF). Global Biogeochemical Cycles. 25 (2): n/a. Bibcode:2011GBioC..25.2002I. doi:10.1029/2010GB003845. hdl:1912/4553. S2CID 17810925. Archived from the original (PDF) on 4 March 2016. Retrieved 29 July 2011.
- ↑ "IPCC AR6 WG1" (PDF). Archived (PDF) from the original on 9 August 2021.
- ↑ "Water vapour: feedback or forcing?". RealClimate. 6 April 2005. Archived from the original on 24 June 2007. Retrieved 1 May 2006.
- ↑ Kiehl, J.T.; Trenberth, Kevin E. (February 1997). "Earth's Annual Global Mean Energy Budget" (PDF). Bulletin of the American Meteorological Society. 78 (2): 197–208. Bibcode:1997BAMS...78..197K. CiteSeerX 10.1.1.168.831. doi:10.1175/1520-0477(1997)078<0197:EAGMEB>2.0.CO;2. Archived from the original (PDF) on 30 March 2006. Retrieved 1 May 2006.
- ↑ Gavin Schmidt (1 October 2010). "Taking the Measure of the Greenhouse Effect". NASA Goddard Institute for Space Studies - Science Briefs. Archived from the original on 21 April 2021. Retrieved 13 January 2022.
- 1 2 3 "Appendix 8.A" (PDF). Intergovernmental Panel on Climate Change Fifth Assessment Report. p. 731. Archived (PDF) from the original on 13 October 2017. Retrieved 6 November 2017.
- ↑ Charles J. Kibert (2016). "Background". Sustainable Construction: Green Building Design and Delivery. Wiley. ISBN 978-1119055327.
- ↑ "Full Mauna Loa CO2 record". Earth System Research Laboratory. 2005. Archived from the original on 28 April 2017. Retrieved 6 May 2017.
- ↑ Tans, Pieter (3 May 2008). "Annual CO2 mole fraction increase (ppm) for 1959–2007". National Oceanic and Atmospheric Administration Earth System Research Laboratory, Global Monitoring Division. "additional details". Archived from the original on 25 December 2018. Retrieved 15 May 2008.; see also Masarie, K.A.; Tans, P.P. (1995). "Extension and integration of atmospheric carbon dioxide data into a globally consistent measurement record". J. Geophys. Res. 100 (D6): 11593–610. Bibcode:1995JGR...10011593M. doi:10.1029/95JD00859. Archived from the original on 8 March 2021. Retrieved 26 July 2019.
- ↑ "The Earth's energy budget, climate feedbacks, and climate sensitivity" (PDF). Archived (PDF) from the original on 9 August 2021.
- 1 2 Blasing (2013)
- 1 2 3 Ehhalt, D.; et al., "Table 4.1", Atmospheric Chemistry and Greenhouse Gases, archived from the original on 3 January 2013, in IPCC TAR WG1 (2001), pp. 244–45. Referred to by: Blasing (2013). Based on Blasing (2013): Pre-1750 concentrations of CH4,N2O and current concentrations of O3, are taken from Table 4.1 (a) of the IPCC Intergovernmental Panel on Climate Change, 2001. Following the convention of IPCC (2001), inferred global-scale trace-gas concentrations from prior to 1750 are assumed to be practically uninfluenced by human activities such as increasingly specialized agriculture, land clearing, and combustion of fossil fuels. Preindustrial concentrations of industrially manufactured compounds are given as zero. The short atmospheric lifetime of ozone (hours-days) together with the spatial variability of its sources precludes a globally or vertically homogeneous distribution, so that a fractional unit such as parts per billion would not apply over a range of altitudes or geographical locations. Therefore a different unit is used to integrate the varying concentrations of ozone in the vertical dimension over a unit area, and the results can then be averaged globally. This unit is called a Dobson Unit (D.U.), after G.M.B. Dobson, one of the first investigators of atmospheric ozone. A Dobson unit is the amount of ozone in a column that, unmixed with the rest of the atmosphere, would be 10 micrometers thick at standard temperature and pressure.
- ↑ Because atmospheric concentrations of most gases tend to vary systematically over the course of a year, figures given represent averages over a 12-month period for all gases except ozone (O3), for which a current global value has been estimated (IPCC, 2001, Table 4.1a). CO2 averages for year 2012 are taken from the National Oceanic and Atmospheric Administration, Earth System Research Laboratory, web site: www.esrl.noaa.gov/gmd/ccgg/trends maintained by Pieter Tans. For other chemical species, the values given are averages for 2011. These data are found on the CDIAC AGAGE web site: http://cdiac.ornl.gov/ndps/alegage.html Archived 21 January 2013 at the Wayback Machine or the AGAGE home page: http://agage.eas.gatech.edu Archived 7 January 2015 at the Wayback Machine.
- 1 2 Forster, P.; et al., "Table 2.1", Changes in Atmospheric Constituents and in Radiative Forcing, archived from the original on 12 October 2012, retrieved 30 October 2012, in IPCC AR4 WG1 (2007), p. 141. Referred to by: Blasing (2013)
- ↑ Prentice, I.C.; et al. "Executive summary". The Carbon Cycle and Atmospheric Carbon Dioxide. Archived from the original on 7 December 2009., in IPCC TAR WG1 (2001), p. 185. Referred to by: Blasing (2013)
- ↑ "Carbon dioxide levels continue at record levels, despite COVID-19 lockdown". WMO.int. World Meteorological Organization. 23 November 2020.
- ↑ IPCC AR4 WG1 (2007), p. 140:"The simple formulae ... in Ramaswamy et al. (2001) are still valid. and give an RF of +3.7 W m–2 for a doubling in the CO2 mixing ratio. ... RF increases logarithmically with mixing ratio" Calculation: ln(new ppm/old ppm)/ln(2)*3.7
- ↑ ppb = parts-per-billion
- 1 2 3 4 The first value in a cell represents Mace Head, Ireland, a mid-latitude Northern-Hemisphere site, while the second value represents Cape Grim, Tasmania, a mid-latitude Southern-Hemisphere site. "Current" values given for these gases are annual arithmetic averages based on monthly background concentrations for year 2011. The SF
6 values are from the AGAGE gas chromatography – mass spectrometer (gc-ms) Medusa measuring system. - ↑ "Advanced Global Atmospheric Gases Experiment (AGAGE)". Archived from the original on 21 January 2013. Retrieved 30 October 2012. Data compiled from finer time scales in the Prinn; etc (2000). "ALE/GAGE/AGAGE database". Archived from the original on 21 January 2013. Retrieved 30 October 2012.
- ↑ The pre-1750 value for N
2O is consistent with ice-core records from 10,000 BCE through 1750 CE: "Summary for policymakers", Figure SPM.1, IPCC, archived from the original on 2 November 2018, retrieved 30 October 2012, in IPCC AR4 WG1 (2007), p. 3. Referred to by: Blasing (2013) - ↑ Changes in stratospheric ozone have resulted in a decrease in radiative forcing of 0.05 W/m2: Forster, P.; et al., "Table 2.12", Changes in Atmospheric Constituents and in Radiative Forcing, archived from the original on 28 January 2013, retrieved 30 October 2012, in IPCC AR4 WG1 (2007), p. 204. Referred to by: Blasing (2013)
- ↑ "SF
6 data from January 2004". Archived from the original on 21 January 2013. Retrieved 2 January 2013. - ↑ "Data from 1995 through 2004". National Oceanic and Atmospheric Administration (NOAA), Halogenated and other Atmospheric Trace Species (HATS).
- ↑ Sturges, W.T.; et al. "Concentrations of SF
6 from 1970 through 1999, obtained from Antarctic firn (consolidated deep snow) air samples". Archived from the original on 21 January 2013. Retrieved 2 January 2013. - ↑ "FAQ 7.1". p. 14. in IPCC AR4 WG1 (2007)
- ↑ Canadell, J.G.; Le Quere, C.; Raupach, M.R.; Field, C.B.; Buitenhuis, E.T.; Ciais, P.; Conway, T.J.; Gillett, N.P.; Houghton, R.A.; Marland, G. (2007). "Contributions to accelerating atmospheric CO2 growth from economic activity, carbon intensity, and efficiency of natural sinks". Proc. Natl. Acad. Sci. USA. 104 (47): 18866–70. Bibcode:2007PNAS..10418866C. doi:10.1073/pnas.0702737104. PMC 2141868. PMID 17962418.
- ↑ "AGU Water Vapor in the Climate System". Eso.org. 27 April 1995. Archived from the original on 20 October 2012. Retrieved 11 September 2011.
- ↑ Betts (2001). "6.3 Well-mixed Greenhouse Gases". Chapter 6 Radiative Forcing of Climate Change. Working Group I: The Scientific Basis IPCC Third Assessment Report – Climate Change 2001. UNEP/GRID-Arendal – Publications. Archived from the original on 29 June 2011. Retrieved 16 October 2010.
- 1 2 Jacob, Daniel (1999). Introduction to atmospheric chemistry. Princeton University Press. pp. 25–26. ISBN 978-0691001852. Archived from the original on 2 September 2011.
- ↑ "How long will global warming last?". RealClimate. 15 March 2005. Archived from the original on 4 March 2021. Retrieved 12 June 2012.
- ↑ Walker, James C.G. (June 1985). "Carbon dioxide on the early earth" (PDF). Origins of Life and Evolution of the Biosphere. 16 (2): 117–27. Bibcode:1985OrLi...16..117W. doi:10.1007/BF01809466. hdl:2027.42/43349. PMID 11542014. S2CID 206804461. Archived (PDF) from the original on 14 September 2012. Retrieved 30 January 2010.
- ↑ Pavlov, Alexander A.; Kasting, James F.; Brown, Lisa L.; Rages, Kathy A.; Freedman, Richard (May 2000). "Greenhouse warming by CH4 in the atmosphere of early Earth". Journal of Geophysical Research. 105 (E5): 11981–90. Bibcode:2000JGR...10511981P. doi:10.1029/1999JE001134. PMID 11543544.
- ↑ Zahnle, K.; Schaefer, L.; Fegley, B. (2010). "Earth's Earliest Atmospheres". Cold Spring Harbor Perspectives in Biology. 2 (10): a004895. doi:10.1101/cshperspect.a004895. PMC 2944365. PMID 20573713.
- ↑ "Many Planets, One Earth // Section 4: Carbon Cycling and Earth's Climate". Many Planets, One Earth. 4. Archived from the original on 17 April 2012. Retrieved 24 June 2012.
- ↑ Falkowski, P.; Scholes, R. J.; Boyle, E.; Canadell, J.; Canfield, D.; Elser, J.; Gruber, N.; Hibbard, K.; Högberg, P.; Linder, S.; MacKenzie, F. T.; Moore III, B.; Pedersen, T.; Rosenthal, Y.; Seitzinger, S.; Smetacek, V.; Steffen, W. (2000). "The Global Carbon Cycle: A Test of Our Knowledge of Earth as a System". Science. 290 (5490): 291–296. Bibcode:2000Sci...290..291F. doi:10.1126/science.290.5490.291. PMID 11030643.
- ↑ Riebeek, Holli (16 June 2011). "The Carbon Cycle". Earth Observatory. NASA. Archived from the original on 5 March 2016. Retrieved 5 April 2018.
- 1 2 "Geoengineering the climate: science, governance and uncertainty". The Royal Society. 2009. Archived from the original on 7 September 2009. Retrieved 12 September 2009.
- ↑ Fischer, B.S.; Nakicenovic, N.; Alfsen, K.; Morlot, J. Corfee; de la Chesnaye, F.; Hourcade, J.-Ch.; Jiang, K.; Kainuma, M.; La Rovere, E.; Matysek, A.; Rana, A.; Riahi, K.; Richels, R.; Rose, S.; van Vuuren, D.; Warren, R., Issues related to mitigation in the long term context (PDF), archived (PDF) from the original on 22 September 2018, retrieved 13 September 2009 in Rogner et al. (2007)
- ↑ Jackson, Robert B.; Abernethy, Sam; Canadell, Josep G.; Cargnello, Matteo; Davis, Steven J.; Féron, Sarah; Fuss, Sabine; Heyer, Alexander J.; Hong, Chaopeng; Jones, Chris D.; Damon Matthews, H.; O'Connor, Fiona M.; Pisciotta, Maxwell; Rhoda, Hannah M.; de Richter, Renaud (15 November 2021). "Atmospheric methane removal: a research agenda". Philosophical Transactions of the Royal Society A: Mathematical, Physical and Engineering Sciences. 379 (2210): 20200454. Bibcode:2021RSPTA.37900454J. doi:10.1098/rsta.2020.0454. ISSN 1364-503X. PMC 8473948. PMID 34565221.
- ↑ "Coal Consumption Affecting Climate". Rodney and Otamatea Times, Waitemata and Kaipara Gazette. Warkworth, New Zealand. 14 August 1912. p. 7. Text was earlier published in Popular Mechanics, March 1912, p. 341.
- ↑ Arrhenius, Svante (1896). "On the influence of carbonic acid in the air upon the temperature of the ground" (PDF). The London, Edinburgh, and Dublin Philosophical Magazine and Journal of Science. 41 (251): 237–276. doi:10.1080/14786449608620846. Archived (PDF) from the original on 18 November 2020. Retrieved 1 December 2020.
- ↑ Arrhenius, Svante (1897). "On the Influence of Carbonic Acid in the Air Upon the Temperature of the Ground". Publications of the Astronomical Society of the Pacific. 9 (54): 14. Bibcode:1897PASP....9...14A. doi:10.1086/121158.
- ↑ Easterbrook, Steve (18 August 2015). "Who first coined the term "Greenhouse Effect"?". Serendipity. Archived from the original on 13 November 2015. Retrieved 11 November 2015.
- ↑ Ekholm N (1901). "On The Variations Of The Climate Of The Geological And Historical Past And Their Causes". Quarterly Journal of the Royal Meteorological Society. 27 (117): 1–62. Bibcode:1901QJRMS..27....1E. doi:10.1002/qj.49702711702.
- ↑ Cook, J.; Nuccitelli, D.; Green, S.A.; Richardson, M.; Winkler, B.R.; Painting, R.; Way, R.; Jacobs, P.; Skuce, A. (2013). "Quantifying the consensus on anthropogenic global warming in the scientific literature". Environmental Research Letters. 8 (2): 024024. Bibcode:2013ERL.....8b4024C. doi:10.1088/1748-9326/8/2/024024.
- ↑ LuAnn Dahlman (14 August 2020). "Climate change: annual greenhouse gas index". NOAA Climate.gov science news & Information for a climate smart nation. Archived from the original on 16 August 2013. Retrieved 5 September 2020.
- ↑ "The NOAA Annual Greenhouse Gas Index (AGGI) - An Introduction". NOAA Global Monitoring Laboratory/Earth System Research Laboratories. Archived from the original on 27 November 2020. Retrieved 5 September 2020.
- ↑ "NOAA CCGG page Retrieved 2 March 2016". Archived from the original on 11 August 2011. Retrieved 14 March 2023.
- ↑ WDCGG webpage Archived 6 April 2016 at the Wayback Machine Retrieved 2 March 2016
- ↑ RAMCES webpage Retrieved 2 March 2016
- ↑ "CDIAC CO2 page Retrieved 9 February 2016". Archived from the original on 13 August 2011. Retrieved 14 March 2023.
- ↑ Eddie Schwieterman. "Comparing the Greenhouse Effect on Earth, Mars, Venus, and Titan: Present Day and through Time" (PDF). Archived from the original (PDF) on 30 January 2015.
Works cited
- Blasing, T.J. (February 2013), Current Greenhouse Gas Concentrations (PDF), doi:10.3334/CDIAC/atg.032, retrieved 30 October 2012
- IPCC TAR WG1 (2001), Houghton, J.T.; Ding, Y.; Griggs, D.J.; Noguer, M.; van der Linden, P.J.; Dai, X.; Maskell, K.; Johnson, C.A. (eds.), Climate Change 2001: The Scientific Basis, Contribution of Working Group I to the Third Assessment Report of the Intergovernmental Panel on Climate Change, Cambridge University Press, ISBN 0-521-80767-0, archived from the original on 15 December 2019, retrieved 18 December 2019
{{citation}}: CS1 maint: numeric names: authors list (link) (pb: 0-521-01495-6) - IPCC (2021). Masson-Delmotte, V.; Zhai, P.; Pirani, A.; Connors, S. L.; et al. (eds.). Climate Change 2021: The Physical Science Basis (PDF). Contribution of Working Group I to the Sixth Assessment Report of the Intergovernmental Panel on Climate Change. Cambridge University Press (In Press).
- IPCC AR4 WG1 (2007), Solomon, S.; Qin, D.; Manning, M.; Chen, Z.; Marquis, M.; Averyt, K.B.; Tignor, M.; Miller, H.L. (eds.), Climate Change 2007: The Physical Science Basis – Contribution of Working Group I (WG1) to the Fourth Assessment Report (AR4) of the Intergovernmental Panel on Climate Change (IPCC), Cambridge University Press, ISBN 978-0521880091
{{citation}}: CS1 maint: numeric names: authors list (link) (pb: ISBN 978-0521705967) - Canadell, Josep G.; Monteiro, Pedro M.S. (2021). "Chapter 5: Global Carbon and other Biogeochemical Cycles and Feedbacks" (PDF). IPCC AR6 WG1 2021.
- Forster, Piers; Storelvmo, Trude (2021). "Chapter 7: The Earth's Energy Budget, Climate Feedbacks, and Climate Sensitivity" (PDF). IPCC AR6 WG1 2021.
- Rogner, H.-H.; Zhou, D.; Bradley, R.; Crabbé, P.; Edenhofer, O.; Hare, B.; Kuijpers, L.; Yamaguchi, M. (2007), B. Metz; O.R. Davidson; P.R. Bosch; R. Dave; L.A. Meyer (eds.), Climate Change 2007: Mitigation. Contribution of Working Group III to the Fourth Assessment Report of the Intergovernmental Panel on Climate Change, Cambridge University Press, ISBN 978-0521880114, archived from the original on 21 January 2012, retrieved 14 January 2012
External links
 Media related to Greenhouse gases at Wikimedia Commons
- Carbon Dioxide Information Analysis Center (CDIAC), U.S. Department of Energy, retrieved 26 July 2020
- Annual Greenhouse Gas Index (AGGI) from NOAA
- Atmospheric spectra of GHGs and other trace gases Archived 25 March 2013 at the Wayback Machine
| |||||||||||||
| |||||||||||||
| |||||||||||||
| |||||||||||||
| |||||||||||||
| |||||||||||||
| |||||||||||||
| |||||||||||||