Humphreys County | |
|---|---|
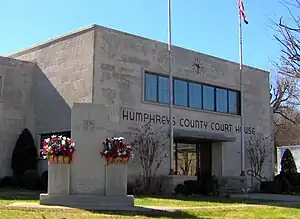
 Humphreys County Courthouse in Waverly | |
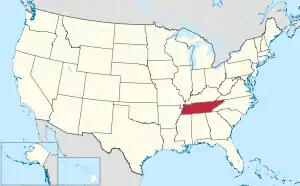
 Location within the U.S. state of Tennessee | |
 Tennessee's location within the U.S. | |
| Coordinates: 36°02′N 87°46′W / 36.03°N 87.77°W | |
| Country | |
| State | |
| Founded | 1809 |
| Named for | Parry Wayne Humphreys[1] |
| Seat | Waverly |
| Largest city | Waverly |
| Area | |
| • Total | 557 sq mi (1,440 km2) |
| • Land | 531 sq mi (1,380 km2) |
| • Water | 26 sq mi (70 km2) 4.6% |
| Population (2020) | |
| • Total | 18,990 |
| • Density | 34/sq mi (13/km2) |
| Time zone | UTC−6 (Central) |
| • Summer (DST) | UTC−5 (CDT) |
| Congressional district | 7th |
| Website | www |
Humphreys County is a county located in the western part of Middle Tennessee, in the U.S. state of Tennessee. As of the 2020 census, the population was 18,990.[2] Its county seat is Waverly.[3]
The county is named after American jurist and politician Parry Wayne Humphreys. It was established in 1809 from the southern portion of Stewart County.[4]
History
Humphreys County was established in 1809 from parts of Stewart County, and named for Parry Wayne Humphreys, a young Justice of the State Supreme Court, who was later elected as US Congressman from this area. The county seat was initially located at Reynoldsburg, near the mouth of Dry Creek. When the western half of the county was taken to form Benton County to the west in 1835, the seat of Humphreys was newly designated as Waverly, a town that was more centrally located in the redefined jurisdiction.[5][6]
During the Civil War, the Battle of Johnsonville was fought for two days in the western half of the county in November 1864. The remnants of the battle site are preserved and interpreted at Johnsonville State Historic Park. But much of the battlefield has been submerged by Kentucky Lake, created by dams on the Tennessee River for flood control.[7]
Since the mid-20th century, this area developed increasing ties with the major city of Nashville. Agricultural areas have been developed for residential communities and suburban businesses. As Nashville and the region have prospered, businesses and supporting services have also developed in this county.
21st century
On the morning of August 21, 2021, storms riding along a stationary front in western Middle Tennessee produced widespread flash flooding across the counties of Stewart, Houston, Dickson, Hickman, and Humphreys. Especially hard hit were the towns of McEwen and Waverly, where many homes and businesses were destroyed by floodwaters along Trace Creek. Twenty people were killed as a result of the flooding throughout the county.[8]
Geography
According to the U.S. Census Bureau, the county has a total area of 557 square miles (1,440 km2), of which 531 square miles (1,380 km2) is land and 26 square miles (67 km2) (4.6%) is water.[9]
Adjacent counties
- Houston County (north)
- Dickson County (northeast)
- Hickman County (southeast)
- Perry County (south)
- Benton County (west)
National protected area
State protected area
Demographics
| Census | Pop. | Note | %± |
|---|---|---|---|
| 1810 | 1,511 | — | |
| 1820 | 4,067 | 169.2% | |
| 1830 | 6,187 | 52.1% | |
| 1840 | 5,195 | −16.0% | |
| 1850 | 6,422 | 23.6% | |
| 1860 | 9,096 | 41.6% | |
| 1870 | 9,326 | 2.5% | |
| 1880 | 11,379 | 22.0% | |
| 1890 | 11,720 | 3.0% | |
| 1900 | 13,398 | 14.3% | |
| 1910 | 13,908 | 3.8% | |
| 1920 | 13,482 | −3.1% | |
| 1930 | 12,039 | −10.7% | |
| 1940 | 12,421 | 3.2% | |
| 1950 | 11,030 | −11.2% | |
| 1960 | 11,511 | 4.4% | |
| 1970 | 13,560 | 17.8% | |
| 1980 | 15,957 | 17.7% | |
| 1990 | 15,795 | −1.0% | |
| 2000 | 17,929 | 13.5% | |
| 2010 | 18,538 | 3.4% | |
| 2020 | 18,990 | 2.4% | |
| U.S. Decennial Census[10] 1790-1960[11] 1900-1990[12] 1990-2000[13] 2010-2014[2] | |||

2020 census
| Race | Number | Percentage |
|---|---|---|
| White (non-Hispanic) | 17,102 | 90.06% |
| Black or African American (non-Hispanic) | 494 | 2.6% |
| Native American | 43 | 0.23% |
| Asian | 57 | 0.3% |
| Other/Mixed | 845 | 4.45% |
| Hispanic or Latino | 449 | 2.36% |
As of the 2020 United States census, there were 18,990 people, 6,763 households, and 4,375 families residing in the county.
2000 census
As of the census[16] of 2000, there were 17,929 people, 7,238 households, and 5,146 families residing in the county. The population density was 33.7 people per square mile (13.0 people/km2). There were 8,482 housing units at an average density of 15.9 units per square mile (6.1 units/km2). The racial makeup of the county was 95.52% White, 2.94% Black or African American, 0.27% Native American, 0.26% Asian, 0.01% Pacific Islander, 0.16% from other races, and 0.85% from two or more races. 0.83% of the population were Hispanic or Latino of any race.
There were 7,238 households, out of which 30.30% had children under the age of 18 living with them, 57.30% were married couples living together, 10.20% had a female householder with no husband present, and 28.90% were non-families. 25.00% of all households were made up of individuals, and 10.60% had someone living alone who was 65 years of age or older. The average household size was 2.44 and the average family size was 2.90.
In the county, the population was spread out, with 23.90% under the age of 18, 7.60% from 18 to 24, 27.50% from 25 to 44, 26.20% from 45 to 64, and 14.80% who were 65 years of age or older. The median age was 39 years. For every 100 females there were 96.80 males. For every 100 females age 18 and over, there were 93.10 males.
The median income for a household in the county was $35,786, and the median income for a family was $42,129. Males had a median income of $31,657 versus $20,736 for females. The per capita income for the county was $17,757. About 7.60% of families and 10.80% of the population were below the poverty line, including 12.50% of those under age 18 and 13.70% of those age 65 or over.
Communities
Cities
- McEwen
- New Johnsonville
- Waverly (county seat)
Unincorporated communities
Politics
| Year | Republican | Democratic | Third party | |||
|---|---|---|---|---|---|---|
| No. | % | No. | % | No. | % | |
| 2020 | 6,120 | 74.31% | 2,017 | 24.49% | 99 | 1.20% |
| 2016 | 4,930 | 68.92% | 1,967 | 27.50% | 256 | 3.58% |
| 2012 | 3,833 | 55.85% | 2,905 | 42.33% | 125 | 1.82% |
| 2008 | 3,818 | 50.37% | 3,600 | 47.49% | 162 | 2.14% |
| 2004 | 3,261 | 41.85% | 4,485 | 57.55% | 47 | 0.60% |
| 2000 | 2,387 | 35.73% | 4,205 | 62.94% | 89 | 1.33% |
| 1996 | 1,892 | 31.43% | 3,675 | 61.05% | 453 | 7.52% |
| 1992 | 1,641 | 26.75% | 3,875 | 63.16% | 619 | 10.09% |
| 1988 | 2,132 | 41.09% | 3,037 | 58.54% | 19 | 0.37% |
| 1984 | 2,249 | 37.91% | 3,668 | 61.82% | 16 | 0.27% |
| 1980 | 1,897 | 31.80% | 3,974 | 66.61% | 95 | 1.59% |
| 1976 | 1,338 | 24.72% | 4,021 | 74.28% | 54 | 1.00% |
| 1972 | 2,263 | 52.17% | 1,973 | 45.48% | 102 | 2.35% |
| 1968 | 866 | 19.90% | 1,391 | 31.96% | 2,095 | 48.14% |
| 1964 | 916 | 22.09% | 3,230 | 77.91% | 0 | 0.00% |
| 1960 | 1,126 | 29.90% | 2,592 | 68.83% | 48 | 1.27% |
| 1956 | 713 | 19.99% | 2,841 | 79.67% | 12 | 0.34% |
| 1952 | 898 | 25.16% | 2,670 | 74.81% | 1 | 0.03% |
| 1948 | 355 | 15.85% | 1,327 | 59.24% | 558 | 24.91% |
| 1944 | 367 | 21.58% | 1,327 | 78.01% | 7 | 0.41% |
| 1940 | 377 | 17.98% | 1,717 | 81.88% | 3 | 0.14% |
| 1936 | 297 | 18.81% | 1,279 | 81.00% | 3 | 0.19% |
| 1932 | 231 | 13.56% | 1,455 | 85.44% | 17 | 1.00% |
| 1928 | 441 | 36.21% | 771 | 63.30% | 6 | 0.49% |
| 1924 | 216 | 17.17% | 1,005 | 79.89% | 37 | 2.94% |
| 1920 | 674 | 30.21% | 1,534 | 68.76% | 23 | 1.03% |
| 1916 | 452 | 27.95% | 1,148 | 71.00% | 17 | 1.05% |
| 1912 | 343 | 18.59% | 1,283 | 69.54% | 219 | 11.87% |
See also
References
- ↑ "About Tennessee: Origins of Tennessee County Names" (PDF). Tennessee Blue Book. State of Tennessee. 2011–2012. p. 599. Archived (PDF) from the original on October 9, 2022. Retrieved October 17, 2013.
- 1 2 "State & County QuickFacts". United States Census Bureau. Archived from the original on June 7, 2011. Retrieved December 2, 2013.
- ↑ "Find a County". National Association of Counties. Archived from the original on May 31, 2011. Retrieved June 7, 2011.
- ↑ Goodspeed, Arthur Weston (1886). Goodspeed's History of Humphreys County, Tennessee. Nashville: Goodspeed Publishing Company. Archived from the original on August 11, 2019.
- ↑ Binkley, Trina L. (January 1, 2010). "Humphreys County". Tennessee Encyclopedia of History and Culture. Retrieved October 17, 2013.
- ↑ Gannett, Henry (1905). The Origin of Certain Place Names in the United States. Geological Survey Bulletin, no. 258 (2nd ed.). Washington, D.C.: Government Printing Office. p. 163. OCLC 1156805.
- ↑ "Johnsonville State Historic Park". Tennessee State Parks. Retrieved October 17, 2013.
- ↑ "Flood-related deaths in Humphreys County rises to 20".
- ↑ "2010 Census Gazetteer Files". United States Census Bureau. August 22, 2012. Retrieved April 5, 2015.
- ↑ "U.S. Decennial Census". United States Census Bureau. Retrieved April 5, 2015.
- ↑ "Historical Census Browser". University of Virginia Library. Retrieved April 5, 2015.
- ↑ Forstall, Richard L., ed. (March 27, 1995). "Population of Counties by Decennial Census: 1900 to 1990". United States Census Bureau. Retrieved April 5, 2015.
- ↑ "Census 2000 PHC-T-4. Ranking Tables for Counties: 1990 and 2000" (PDF). United States Census Bureau. April 2, 2001. Archived (PDF) from the original on October 9, 2022. Retrieved April 5, 2015.
- ↑ Based on 2000 census data.
- ↑ "Explore Census Data". data.census.gov. Retrieved December 27, 2021.
- ↑ "U.S. Census website". United States Census Bureau. Retrieved May 14, 2011.
- ↑ Leip, David. "Dave Leip's Atlas of U.S. Presidential Elections". uselectionatlas.org. Retrieved March 10, 2018.
External links
- Official site
- Humphreys County, TNGenWeb - free genealogy resources for the county
- Humphreys County at Curlie