| ||||||||||||||||||||||||||||
40 of 59 total seats in the Illinois Senate 30 seats needed for a majority | ||||||||||||||||||||||||||||
|---|---|---|---|---|---|---|---|---|---|---|---|---|---|---|---|---|---|---|---|---|---|---|---|---|---|---|---|---|
| ||||||||||||||||||||||||||||
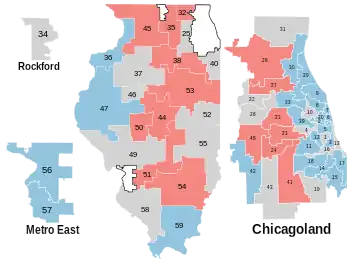 Results: Democratic hold Republican hold No election | ||||||||||||||||||||||||||||
| ||||||||||||||||||||||||||||
.jpg.webp)

| Elections in Illinois |
|---|
 |
The Illinois State Senate Election of 2008 determined, along with 19 senators not up for re-election, the membership of the 96th Illinois State Senate. The Democratic Party retained its majority.
Overview
| Illinois State Senate Elections, 2008 | |||||||
|---|---|---|---|---|---|---|---|
| Party | Votes | Percentage | Seats up |
Seats not up |
Total seats |
+/– | |
| Democratic | 1,791,386 | 54.81% | 24 | 13 | 37 | 0 | |
| Republican | 1,457,074 | 44.58% | 16 | 6 | 22 | 0 | |
| Green | 19,818 | 0.61% | 0 | 0 | 0 | 0 | |
| Independent | 116 | 0.004% | 0 | 0 | 0 | 0 | |
| Totals | 3,268,394 | 100.00% | 40 | 19 | 59 | — | |
Individual Results
The following are results by individual districts.
2nd District
| Party | Candidate | Votes | % | |
|---|---|---|---|---|
| Democratic | William 'Willie' Delgado | 42,002 | 100.00 | |
| Total votes | 42,002 | 100.00 | ||
| Democratic hold | ||||
3rd District
| Party | Candidate | Votes | % | |
|---|---|---|---|---|
| Democratic | Mattie Hunter | 53,889 | 100.00 | |
| Total votes | 53,889 | 100.00 | ||
| Democratic hold | ||||
5th District
| Party | Candidate | Votes | % | |
|---|---|---|---|---|
| Democratic | Rickey R. Hendon | 69,229 | 85.97 | |
| Republican | Jason Allen Braswell | 11,297 | 4.03 | |
| Total votes | 80,526 | 100.00 | ||
| Democratic hold | ||||
6th District
| Party | Candidate | Votes | % | |
|---|---|---|---|---|
| Democratic | John Cullerton | 73,323 | 77.47 | |
| Republican | Jay Valko | 21,320 | 22.53 | |
| Total votes | 94,643 | 100.00 | ||
| Democratic hold | ||||
7th District
| Party | Candidate | Votes | % | |
|---|---|---|---|---|
| Democratic | Heather Steans | 55,457 | 83.08 | |
| Green | Tom Durkin | 11,297 | 16.92 | |
| Total votes | 66,754 | 100.00 | ||
| Democratic hold | ||||
8th District
| Party | Candidate | Votes | % | |
|---|---|---|---|---|
| Democratic | Ira I. Silverstein | 55,691 | 100.00 | |
| Total votes | 55,691 | 100.00 | ||
| Democratic hold | ||||
9th District
| Party | Candidate | Votes | % | |
|---|---|---|---|---|
| Democratic | Jeffrey Schoenberg | 70,746 | 70.9 | |
| Republican | Brendan Appel | 29,036 | 29.1 | |
| Total votes | 99,782 | 100.00 | ||
| Democratic hold | ||||
11th District
| Party | Candidate | Votes | % | |
|---|---|---|---|---|
| Democratic | Louis S. Viverito | 51,353 | 70. | |
| Republican | Jeffrey Malinowski | 21,213 | 29.2 | |
| Total votes | 72,748 | 100.00 | ||
| Democratic hold | ||||
12th District
| Party | Candidate | Votes | % | |
|---|---|---|---|---|
| Democratic | Martin A. Sandoval | 33,807 | 100.00 | |
| Total votes | 33,807 | 100.00 | ||
| Democratic hold | ||||
14th District
| Party | Candidate | Votes | % | |
|---|---|---|---|---|
| Democratic | Emil Jones III | 76,090 | 80.1 | |
| Republican | Ray Wardingley | 18,929 | 19.9 | |
| Total votes | 95,019 | 100.00 | ||
| Democratic hold | ||||
15th District
| Party | Candidate | Votes | % | |
|---|---|---|---|---|
| Democratic | James T. Meeks | 72,950 | 100.00 | |
| Total votes | 72,950 | 100.00 | ||
| Democratic hold | ||||
17th District
| Party | Candidate | Votes | % | |
|---|---|---|---|---|
| Democratic | Donne f. Trotter | 79,070 | 100.000 | |
| Total votes | 79,070 | 100.00 | ||
| Democratic hold | ||||
18th District
| Party | Candidate | Votes | % | |
|---|---|---|---|---|
| Democratic | Edward d. Maloney | 75,229 | 99.92 | |
| Independent | Brendan Appel | 58 | 0.08 | |
| Total votes | 75,287 | 100.00 | ||
| Democratic hold | ||||
20th District
| Party | Candidate | Votes | % | |
|---|---|---|---|---|
| Democratic | Iris Y. Martinez | 42,310 | 100.00 | |
| Total votes | 42,310 | 100.00 | ||
| Democratic hold | ||||
21st District
| Party | Candidate | Votes | % | |
|---|---|---|---|---|
| Republican | Dan Cronin | 64,062 | 63.14 | |
| Democratic | A. Ghani | 30 771 | 30.33 | |
| Green | John Basco | 6,628 | 6.53 | |
| Total votes | 101,461 | 100.00 | ||
| Republican hold | ||||
23rd District
| Party | Candidate | Votes | % | |
|---|---|---|---|---|
| Republican | Carole Pankau | 61,795 | 99.91 | |
| Independent | Kevin Allen | 58 | 0.09 | |
| Total votes | 61,853 | 100.00 | ||
| Republican hold | ||||
24th District
| Party | Candidate | Votes | % | |
|---|---|---|---|---|
| Republican | Kirk W. Dillard | 80,766 | 100.00 | |
| Total votes | 80,766 | 100.00 | ||
| Republican hold | ||||
26th District
| Party | Candidate | Votes | % | |
|---|---|---|---|---|
| Republican | Dan Duffy | 68,463 | 62.1 | |
| Democratic | Brendan Appel | 41,740 | 37.9 | |
| Total votes | 110,203 | 100.00 | ||
| Republican hold | ||||
27th District
| Party | Candidate | Votes | % | |
|---|---|---|---|---|
| Republican | Matt Murphy | 52,202 | 58.4 | |
| Democratic | Peter Gutzmer | 37,220 | 41.6 | |
| Total votes | 89,422 | 100.00 | ||
| Republican hold | ||||
29th District
| Party | Candidate | Votes | % | |
|---|---|---|---|---|
| Democratic | Susan Garret | 72,911 | 100.00 | |
| Total votes | 72,911 | 100.00 | ||
| Democratic hold | ||||
30th District
| Party | Candidate | Votes | % | |
|---|---|---|---|---|
| Democratic | Terry Link | 42,407 | 64.7 | |
| Republican | Keith Grey | 23,141 | 35.3 | |
| Total votes | 65,548 | 100.00 | ||
| Democratic hold | ||||
32nd District
| Party | Candidate | Votes | % | |
|---|---|---|---|---|
| Republican | Pamela J. Althoff | 93,855 | 100.00 | |
| Total votes | 93,855 | 100.00 | ||
| Republican hold | ||||
33rd District
| Party | Candidate | Votes | % | |
|---|---|---|---|---|
| Democratic | Dan Kotowski | 48,344 | 59.95 | |
| Republican | Michael H. Sweeney | 32,293 | 40.05 | |
| Total votes | 80,637 | 100.00 | ||
| Democratic hold | ||||
35th District
| Party | Candidate | Votes | % | |
|---|---|---|---|---|
| Republican | J. Bradley Burzynski | 61,749 | 58.98 | |
| Democratic | Ryan Gailey | 42,948 | 41.02 | |
| Total votes | 104,697 | 100.00 | ||
| Democratic hold | ||||
36th District
| Party | Candidate | Votes | % | |
|---|---|---|---|---|
| Democratic | Mike Jacobs | 55,448 | 58.78 | |
| Republican | Michael Bertelsen | 38,882 | 41.22 | |
| Total votes | 94,330 | 100.00 | ||
| Democratic hold | ||||
38th District
| Party | Candidate | Votes | % | |
|---|---|---|---|---|
| Republican | Gary G. Dahl | 62,790 | 61.88 | |
| Democratic | Steve Stout | 38,687 | 38.12 | |
| Total votes | 101,477 | 100.00 | ||
| Democratic hold | ||||
39th District
| Party | Candidate | Votes | % | |
|---|---|---|---|---|
| Democratic | Don Harmon | 57,487 | 100.00 | |
| Total votes | 57,487 | 100.00 | ||
| Democratic hold | ||||
41st District
| Party | Candidate | Votes | % | |
|---|---|---|---|---|
| Republican | Christine Radogno | 74,777 | 63.57 | |
| Democratic | Audrey Manly | 42,848 | 36.43 | |
| Total votes | 117,625 | 100.00 | ||
| Republican hold | ||||
42nd district
| Party | Candidate | Votes | % | |
|---|---|---|---|---|
| Democratic | Linda Holmes | 57,231 | 54.61 | |
| Republican | Terri Ann Wintermute | 47,567 | 45.39 | |
| Total votes | 104,798 | 100.00 | ||
| Republican hold | ||||
44th District
| Party | Candidate | Votes | % | |
|---|---|---|---|---|
| Republican | Bill Brady | 82,718 | 100.00 | |
| Total votes | 82,718 | 100.00 | ||
| Republican hold | ||||
45th District
| Party | Candidate | Votes | % | |
|---|---|---|---|---|
| Republican | Tim Bivins | 61,310 | 63.18 | |
| Democratic | Marty Mulcahey | 35,728 | 36.82 | |
| Total votes | 97,038 | 100.00 | ||
| Republican hold | ||||
47th District
| Party | Candidate | Votes | % | |
|---|---|---|---|---|
| Democratic | John M. Sullivan | 77,597 | 100.00 | |
| Total votes | 77.597 | 100.00 | ||
| Democratic hold | ||||
48th District
| Party | Candidate | Votes | % | |
|---|---|---|---|---|
| Republican | Randall M. "Randy" Hultgren | 77,310 | 100.00 | |
| Total votes | 77,310 | 100.00 | ||
| Republican hold | ||||
50th District
| Party | Candidate | Votes | % | |
|---|---|---|---|---|
| Republican | Larry K. Bomke | 82,011 | 77.75 | |
| Democratic | John Devine | 23,474 | 22.25 | |
| Total votes | 105,485 | 100.00 | ||
| Republican hold | ||||
51st District
| Party | Candidate | Votes | % | |
|---|---|---|---|---|
| Republican | Frank Watson | 82,718 | 100.00 | |
| Total votes | 82,718 | 100.00 | ||
| Republican hold | ||||
53rd District
| Party | Candidate | Votes | % | |
|---|---|---|---|---|
| Republican | Dan Rutherford | 90,199 | 100.00 | |
| Total votes | 90,199 | 100.00 | ||
| Republican hold | ||||
54th District
| Party | Candidate | Votes | % | |
|---|---|---|---|---|
| Republican | John O. Jones | 63,944 | 70.05 | |
| Democratic | Henry S. Kijonka | 27,337 | 29.95 | |
| Total votes | 76,108 | 100.00 | ||
| Republican hold | ||||
56th District
| Party | Candidate | Votes | % | |
|---|---|---|---|---|
| Democratic | William R. Haine | 82,672 | 100.00 | |
| Total votes | 82,672 | 100.00 | ||
| Democratic hold | ||||
57th District
| Party | Candidate | Votes | % | |
|---|---|---|---|---|
| Democratic | James Clayborne, Jr. | 76,108 | 100.00 | |
| Total votes | 76,108 | 100.00 | ||
| Democratic hold | ||||
59th District
| Party | Candidate | Votes | % | |
|---|---|---|---|---|
| Democratic | Gary Forby | 49,552 | 51.47 | |
| Republican | Ken W. Burzynski | 46,727 | 48.53 | |
| Total votes | 96,279 | 100.00 | ||
| Democratic hold | ||||
External links
This article is issued from Wikipedia. The text is licensed under Creative Commons - Attribution - Sharealike. Additional terms may apply for the media files.