Jiangkou County
江口县 Kiangkow | |
|---|---|
 | |
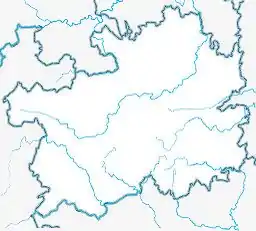 Jiangkou Location of the seat in Guizhou 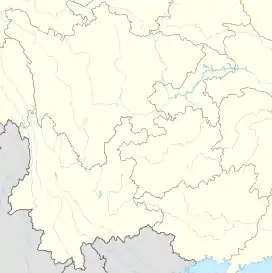 Jiangkou Jiangkou (Southwest China) | |
| Coordinates (Jiangkou County government): 27°42′18″N 108°50′38″E / 27.7049°N 108.8440°E | |
| Country | People's Republic of China |
| Province | Guizhou |
| Prefecture-level city | Tongren |
| Area | |
| • Total | 1,869 km2 (722 sq mi) |
| Population (2010) | |
| • Total | 172,753 |
| • Density | 92/km2 (240/sq mi) |
| Time zone | UTC+8 (China Standard) |
Jiangkou County (Chinese: 江口县; pinyin: Jiāngkǒu Xiàn) is a county under the jurisdiction of the prefecture-level city of Tongren, in the northeast of Guizhou Province, China.
Area: 1,869 km2 (722 sq mi)
Population: 220,000 in 2002.
Postal Code: 554400.
The county government is located in Shuangjiang town.
Climate
| Climate data for Jiangkou (1991–2018 normals, extremes 1981–2010) | |||||||||||||
|---|---|---|---|---|---|---|---|---|---|---|---|---|---|
| Month | Jan | Feb | Mar | Apr | May | Jun | Jul | Aug | Sep | Oct | Nov | Dec | Year |
| Record high °C (°F) | 26.3 (79.3) |
31.0 (87.8) |
36.4 (97.5) |
35.8 (96.4) |
37.2 (99.0) |
36.9 (98.4) |
39.1 (102.4) |
39.5 (103.1) |
39.0 (102.2) |
35.6 (96.1) |
31.5 (88.7) |
24.1 (75.4) |
39.5 (103.1) |
| Mean daily maximum °C (°F) | 8.9 (48.0) |
11.6 (52.9) |
16.1 (61.0) |
22.3 (72.1) |
26.4 (79.5) |
29.1 (84.4) |
32.3 (90.1) |
32.1 (89.8) |
28.4 (83.1) |
22.2 (72.0) |
17.1 (62.8) |
11.4 (52.5) |
21.5 (70.7) |
| Daily mean °C (°F) | 5.4 (41.7) |
7.6 (45.7) |
11.4 (52.5) |
16.9 (62.4) |
21.0 (69.8) |
24.3 (75.7) |
26.8 (80.2) |
26.3 (79.3) |
22.8 (73.0) |
17.6 (63.7) |
12.6 (54.7) |
7.5 (45.5) |
16.7 (62.0) |
| Mean daily minimum °C (°F) | 3.1 (37.6) |
5.0 (41.0) |
8.4 (47.1) |
13.4 (56.1) |
17.5 (63.5) |
21.1 (70.0) |
23.1 (73.6) |
22.6 (72.7) |
19.3 (66.7) |
14.6 (58.3) |
9.7 (49.5) |
4.9 (40.8) |
13.6 (56.4) |
| Record low °C (°F) | −4.5 (23.9) |
−4.3 (24.3) |
−2.1 (28.2) |
3.0 (37.4) |
7.6 (45.7) |
13.7 (56.7) |
15.1 (59.2) |
16.1 (61.0) |
11.3 (52.3) |
4.7 (40.5) |
−1.4 (29.5) |
−4.0 (24.8) |
−4.5 (23.9) |
| Average precipitation mm (inches) | 40.3 (1.59) |
43.6 (1.72) |
68.9 (2.71) |
122.2 (4.81) |
190.6 (7.50) |
229.0 (9.02) |
219.6 (8.65) |
162.4 (6.39) |
103.2 (4.06) |
92.4 (3.64) |
61.1 (2.41) |
33.1 (1.30) |
1,366.4 (53.8) |
| Average precipitation days (≥ 0.1 mm) | 13.2 | 13.1 | 16.8 | 17.1 | 18.0 | 17.1 | 14.5 | 12.8 | 11.0 | 14.0 | 11.3 | 11.1 | 170 |
| Average snowy days | 4.2 | 2.6 | 0.5 | 0 | 0 | 0 | 0 | 0 | 0 | 0 | 0 | 1.8 | 9.1 |
| Average relative humidity (%) | 79 | 79 | 80 | 81 | 81 | 84 | 81 | 80 | 80 | 81 | 81 | 78 | 80 |
| Mean monthly sunshine hours | 39.4 | 41.9 | 60.2 | 83.7 | 99.6 | 94.8 | 160.4 | 171.6 | 123.6 | 82.9 | 71.6 | 57.1 | 1,086.8 |
| Percent possible sunshine | 12 | 13 | 16 | 22 | 24 | 23 | 38 | 43 | 34 | 24 | 22 | 18 | 24 |
| Source: China Meteorological Administration[1][2] | |||||||||||||
References
- ↑ 中国气象数据网 – WeatherBk Data (in Simplified Chinese). China Meteorological Administration. Retrieved 28 April 2023.
- ↑ 中国气象数据网 (in Simplified Chinese). China Meteorological Administration. Retrieved 28 April 2023.
External links
- Official website of Jiangkou County Government Archived 2008-12-16 at the Wayback Machine
This article is issued from Wikipedia. The text is licensed under Creative Commons - Attribution - Sharealike. Additional terms may apply for the media files.