Liebenwalde | |
|---|---|
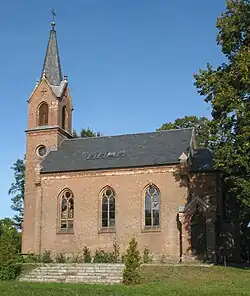 Kreuzbruch church | |
 Coat of arms | |
Location of Liebenwalde within Oberhavel district  | |
 Liebenwalde 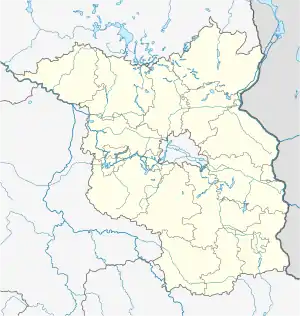 Liebenwalde | |
| Coordinates: 52°52′N 13°24′E / 52.867°N 13.400°E | |
| Country | Germany |
| State | Brandenburg |
| District | Oberhavel |
| Subdivisions | 6 districts |
| Government | |
| • Mayor (2019–27) | Jörn Lehmann[1] |
| Area | |
| • Total | 138.84 km2 (53.61 sq mi) |
| Elevation | 41 m (135 ft) |
| Population (2021-12-31)[2] | |
| • Total | 4,415 |
| • Density | 32/km2 (82/sq mi) |
| Time zone | UTC+01:00 (CET) |
| • Summer (DST) | UTC+02:00 (CEST) |
| Postal codes | 16559 |
| Dialling codes | 033054 |
| Vehicle registration | OHV |
| Website | www.liebenwalde.de |
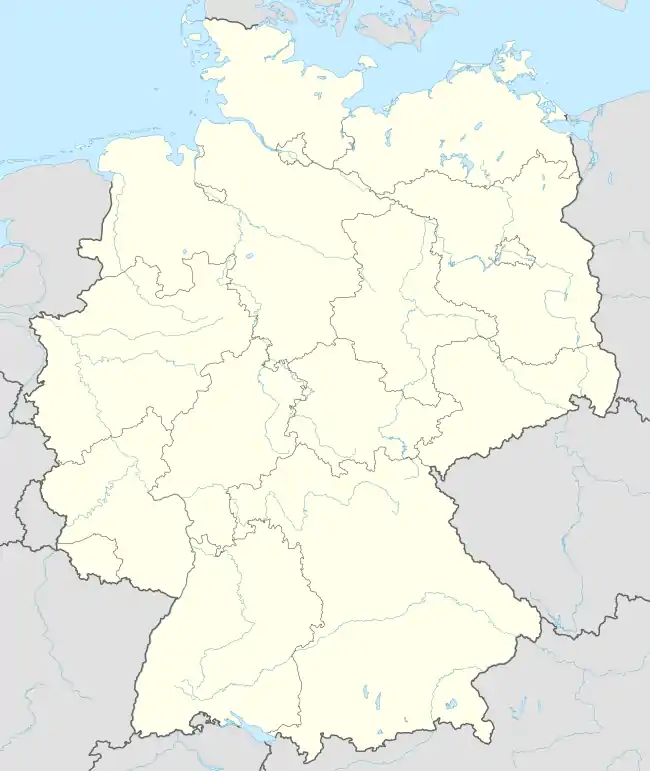
Liebenwalde is a town in the Oberhavel district, in Brandenburg, in north-eastern Germany. It is situated 16 km (10 mi) northeast of Oranienburg, and 39 km (24 mi) north of Berlin (centre).
History
In 1319, the town was captured by Henry II, Lord of Mecklenburg, then in mid-1320 it was captured by Wartislaw IV, Duke of Pomerania, and recaptured by Henry II by the end of 1320.[3] Afterwards it passed to the Margraviate of Brandenburg, and from 1373 to 1415 it was part of the Lands of the Bohemian (Czech) Crown.
In 2003, the administrative boundaries were expanded to include Freienhagen, Hammer, Kreuzbruch, Liebenthal and Neuholland.
Demography
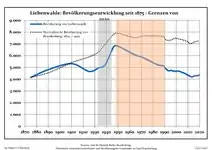 Development of Population since 1875 within the Current Boundaries (Blue Line: Population; Dotted Line: Comparison to Population Development of Brandenburg state; Grey Background: Time of Nazi rule; Red Background: Time of Communist rule)
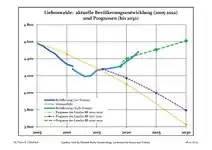 Recent Population Development and Projections (Population Development before Census 2011 (blue line); Recent Population Development according to the Census in Germany in 2011 (blue bordered line); Official projections for 2005-2030 (yellow line); for 2020-2030 (green line); for 2017-2030 (scarlet line)
|
|
|
References
- ↑ Landkreis Oberhavel Wahl der Bürgermeisterin / des Bürgermeisters, accessed 2 July 2021.
- ↑ "Bevölkerungsentwicklung und Flächen der kreisfreien Städte, Landkreise und Gemeinden im Land Brandenburg 2021" (PDF). Amt für Statistik Berlin-Brandenburg (in German). June 2022.
- ↑ Rymar, Edward (1979). "Rywalizacja o ziemię lubuską i kasztelanię międzyrzecką w latach 1319–1326, ze szczególnym uwzględnieniem stosunków pomorsko-śląskch". Śląski Kwartalnik Historyczny Sobótka (in Polish). Wrocław: Zakład Narodowy im. Ossolińskich, Wydawnictwo Polskiej Akademii Nauk. XXXIV (4): 477, 485–486.
- ↑ Detailed data sources are to be found in the Wikimedia Commons.Population Projection Brandenburg at Wikimedia Commons

Zehdenicker Str.
Towns and municipalities in Oberhavel | ||
|---|---|---|
Coat of Arms of Oberhavel district | ||
This article is issued from Wikipedia. The text is licensed under Creative Commons - Attribution - Sharealike. Additional terms may apply for the media files.