Nõmme | |
|---|---|
District of Tallinn | |
 Bridge near the Nõmme center with TalTech's motto. | |
 Flag  Coat of arms | |
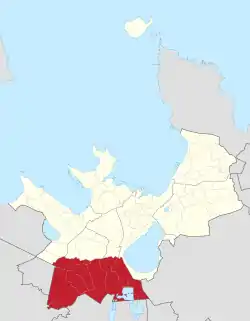
 Location of Nõmme in Tallinn. | |
| Coordinates: 59°22′33″N 24°40′41″E / 59.37583°N 24.67806°E | |
| Country | Estonia |
| County | Harju County |
| City | Tallinn |
| Government | |
| • District Elder | Grete Šillis (Centre Party) |
| Area | |
| • Total | 28.0 km2 (10.8 sq mi) |
| Population (01.01.2019[1]) | |
| • Total | 39,422 |
| • Density | 1,400/km2 (3,600/sq mi) |
| Website | tallinn.ee |
Nõmme (Estonian for 'heath') is one of the eight administrative districts (Estonian: linnaosa) of Tallinn, the capital of Estonia. It has a population of 39,422 (As of 1 January 2019)[1] and covers an area of 28 km2 (11 sq mi), population density is 1,407.9/km2 (3,647/sq mi). The district is largely a middle-class [2] suburban area, mostly consisting of listed private homes [3] from the 1920s and 1930s and is sometimes referred to as the "Forest Town."
History
Nõmme was founded by Nikolai von Glehn, the owner of Jälgimäe Manor, in 1873 [4] as a summerhouse district. The development started around the railway station. In 1926 it was granted town rights, but in the beginning of the Soviet occupation in 1940, it was merged with Tallinn and remains as one of the eight districts of Tallinn to date.
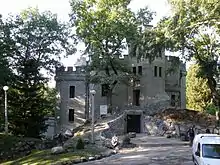
There are many historical sights in Nõmme, such as Glehn Castle, the sculpture Kalevipoeg (also known as "Glehn's Devil"), the Victoria Palace cinema, and Nõmme Market. Other important sights include Vanaka Hill, the ski jumping tower, Rahumäe cemetery, and Pääsküla Bog.
Geography
Nõmme is divided into 10 subdistricts (Estonian: asum): Hiiu, Kivimäe, Laagri, Liiva, Männiku, Nõmme, Pääsküla, Rahumäe, Raudalu, and Vana-Mustamäe.
There are six stations in Nõmme on the western route of Elron: Rahumäe, Nõmme, Hiiu, Kivimäe, Pääsküla, and Laagri. The western route of Edelaraudtee passes through Liiva station, which is also located in Nõmme.
Population
Nõmme has a population of 39,422 (As of 1 January 2019).[1]
| Ethnicity | 1989[5] | 2000[5] | 2011[6] | 2021[7] | ||||
|---|---|---|---|---|---|---|---|---|
| amount | % | amount | % | amount | % | amount | % | |
| Estonians | 31837 | 72.5 | 30423 | 81.8 | 30484 | 86.0 | 29405 | 84.8 |
| Russians | 9285 | 21.1 | 5053 | 13.6 | 3819 | 10.8 | 3657 | 10.5 |
| Ukrainians | - | - | - | - | 388 | 1.09 | 453 | 1.31 |
| Belarusians | - | - | - | - | 178 | 0.50 | 137 | 0.40 |
| Finns | - | - | - | - | 109 | 0.31 | 138 | 0.40 |
| Jews | - | - | - | - | 44 | 0.12 | 35 | 0.10 |
| Latvians | - | - | - | - | 28 | 0.08 | 69 | 0.20 |
| Germans | - | - | - | - | 22 | 0.06 | 48 | 0.14 |
| Tatars | - | - | - | - | 27 | 0.08 | 29 | 0.08 |
| Poles | - | - | - | - | 41 | 0.12 | 39 | 0.11 |
| Lithuanians | - | - | - | - | 43 | 0.12 | 46 | 0.13 |
| unknown | 0 | 0.00 | 201 | 0.54 | 26 | 0.07 | 121 | 0.35 |
| other | 2782 | 6.34 | 1526 | 4.10 | 254 | 0.72 | 503 | 1.45 |
| Total | 43904 | 100 | 37203 | 100 | 35463 | 100 | 34680 | 100 |
| Year | 2004 | 2005 | 2006 | 2007 | 2008 | 2009 | 2010 | 2011 | 2012 | 2013 | 2014 | 2015 | 2016 | 2017 | 2018 | 2019 |
|---|---|---|---|---|---|---|---|---|---|---|---|---|---|---|---|---|
| Population | 37,772 | 39,102 | 39,436 | 38,856 | 38,725 | 38,428 | 38,100 | 38,275 | 38,898 | 39,049 | 39,487 | 39,501 | 39,448 | 39,357 | 39,538 | 39,422 |
Image gallery

 Nõmme Gymnasium (secondary school)
 Post office
 Hiiu Õlletuba pub
 Nõmme center
 Pääsküla bog
See also
References
- 1 2 3 "Tallinna elanike arv" (in Estonian). Tallinn City Government. Retrieved 10 December 2019.
- ↑ "VKR".
- ↑ "Miljööalad".
- ↑ "Nõmme ajalugu". www.tallinn.ee. Archived from the original on 2008-09-28.
- 1 2 2000. aasta rahva ja eluruumide loendus (PDF) (in Estonian and English). Tallinn: Statistikaamet. 2001. pp. 69, 78. ISBN 9985-74-167-6.
- ↑ "RL0429: RAHVASTIK RAHVUSE, SOO, VANUSERÜHMA JA ELUKOHA JÄRGI, 31. DETSEMBER 2011". Estonian Statistical Database (in Estonian).
- ↑ "RL21429: RAHVASTIK RAHVUSE, SOO, VANUSERÜHMA JA ELUKOHA (HALDUSÜKSUS) JÄRGI, 31. DETSEMBER 2021". Estonian Statistical Database (in Estonian).
