
Climate change scenarios or socioeconomic scenarios are projections of future greenhouse gas (GHG) emissions used by analysts to assess future vulnerability to climate change.[3] Scenarios and pathways are created by scientists[4] to survey any long term routes and explore the effectiveness of mitigation and helps us understand what the future may hold. This will allow us to envision the future of human environment system.[4] Producing scenarios requires estimates of future population levels, economic activity, the structure of governance, social values, and patterns of technological change. Economic and energy modelling (such as the World3 or the POLES models) can be used to analyze and quantify the effects of such drivers.
Scientists can develop separate international, regional and national climate change scenarios. These scenarios are designed to help stakeholders understand what kinds of decisions will have meaningful effects on climate change mitigation or adaptation. Most countries developing adaptation plans or Nationally Determined Contributions will commission scenario studies in order to better understand the decisions available to them.
International goals for mitigating climate change through international processes like the Paris Agreement are based on reviews of these scenarios. For example, the Special Report on Global Warming of 1.5 °C was released in 2018 order to reflect more up-to-date models of emissions, Nationally Determined Contributions, and impacts of climate change than its predecessor IPCC Fifth Assessment Report published in 2014 before the Paris Agreement.[5]
Purpose
Climate change scenarios can be thought of as stories of possible futures. They allow the description of factors that are difficult to quantify, such as governance, social structures, and institutions. There is considerable variety among scenarios, ranging from variants of sustainable development, to the collapse of social, economic, and environmental systems.[6]
A baseline scenario is used as a reference for comparison against an alternative scenario, e.g., a mitigation scenario.[7] A wide range of quantitative projections of greenhouse gas emissions have been produced.[8] The "SRES" scenarios are "baseline" emissions scenarios (i.e., they assume that no future efforts are made to limit emissions),[9] and have been frequently used in the scientific literature (see Special Report on Emissions Scenarios for details).
Tools
Shared Socioeconomic Pathways

Shared Socioeconomic Pathways (SSPs) are climate change scenarios of projected socioeconomic global changes up to 2100 as defined in the IPCC Sixth Assessment Report on climate change in 2021.[11] They are used to derive greenhouse gas emissions scenarios with different climate policies.[12][13][14] The SSPs provide narratives describing alternative socio-economic developments. These storylines are a qualitative description of logic relating elements of the narratives to each other.[12] In terms of quantitative elements, they provide data accompanying the scenarios on national population, urbanization and GDP (per capita).[15] The SSPs can be quantified with various Integrated Assessment Models (IAMs) to explore possible future pathways both with regards to socioeconomic and climate pathways.[13][14][15]
The five scenarios are:
- SSP1: Sustainability ("Taking the Green Road")
- SSP2: "Middle of the Road"
- SSP3: Regional Rivalry ("A Rocky Road")
- SSP4: Inequality ("A Road Divided")
- SSP5: Fossil-fueled Development ("Taking the Highway") [16]
Representative Concentration Pathway
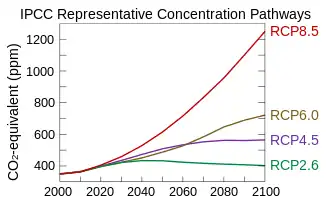
A Representative Concentration Pathway (RCP) is a greenhouse gas concentration (not emissions) trajectory adopted by the IPCC. Four pathways were used for climate modeling and research for the IPCC Fifth Assessment Report (AR5) in 2014. The pathways describe different climate change scenarios, all of which are considered possible depending on the amount of greenhouse gases (GHG) emitted in the years to come. The RCPs – originally RCP2.6, RCP4.5, RCP6, and RCP8.5 – are labelled after a possible range of radiative forcing values in the year 2100 (2.6, 4.5, 6, and 8.5 W/m2, respectively).[17][18][19] The higher values mean higher greenhouse gas emissions and therefore higher global temperatures and more pronounced effects of climate change. The lower RCP values, on the other hand, are more desirable for humans but require more stringent climate change mitigation efforts to achieve them.
A short description of the four RCPs is as follows: RCP 1.9 is a pathway that limits global warming to below 1.5 °C, the aspirational goal of the Paris Agreement.[20] RCP 2.6 is a "very stringent" pathway.[20] RCP 3.4 represents an intermediate pathway between the "very stringent" RCP2.6 and less stringent mitigation efforts associated with RCP4.5.[21] RCP 4.5 is described by the IPCC as an intermediate scenario.[22] In RCP 6, emissions peak around 2080, then decline.[23] RCP7 is a baseline outcome rather than a mitigation target.[20] In RCP 8.5 emissions continue to rise throughout the 21st century.[24]: Figure 2, p. 223
Since IPCC's Fifth Assessment report the original pathways are being considered together with Shared Socioeconomic Pathways: as are new RCPs such as RCP1.9, RCP3.4 and RCP7.[20]Factors affecting future GHG emissions
No strong patterns were found in the relationship between economic activity and GHG emissions. Economic growth was found to be compatible with increasing or decreasing GHG emissions. In the latter case, emissions growth is mediated by increased energy efficiency, shifts to non-fossil energy sources, and/or shifts to a post-industrial (service-based) economy.
Factors affecting the emission projections include:
- Population projections: All other factors being equal, lower population projections result in lower emissions projections.
- Economic development: Economic activity is a dominant driver of energy demand and thus of GHG emissions.
- Energy use: Future changes in energy systems are a fundamental determinant of future GHG emissions.
- Energy intensity: This is the total primary energy supply (TPES) per unit of GDP.[25] In all of the baseline scenarios assessments, energy intensity was projected to improve significantly over the 21st century. The uncertainty range in projected energy intensity was large.[26]
- Carbon intensity: This is the CO2 emissions per unit of TPES. Compared with other scenarios, Fisher et al. (2007) found that the carbon intensity was more constant in scenarios where no climate policy had been assumed.[26] The uncertainty range in projected carbon intensity was large. At the high end of the range, some scenarios contained the projection that energy technologies without CO2 emissions would become competitive without climate policy. These projections were based on the assumption of increasing fossil fuel prices and rapid technological progress in carbon-free technologies. Scenarios with a low improvement in carbon intensity coincided with scenarios that had a large fossil fuel base, less resistance to coal consumption, or lower technology development rates for fossil-free technologies.
- Land-use change: Land-use change plays an important role in climate change, impacting on emissions, sequestration and albedo. One of the dominant drivers in land-use change is food demand. Population and economic growth are the most significant drivers of food demand.[27]
In producing scenarios, an important consideration is how social and economic development will progress in developing countries.[26] If, for example, developing countries were to follow a development pathway similar to the current industrialized countries, it could lead to a very large increase in emissions. Emissions do not only depend on the growth rate of the economy. Other factors include the structural changes in the production system, technological patterns in sectors such as energy, geographical distribution of human settlements and urban structures (this affects, for example, transportation requirements), consumption patterns (e.g., housing patterns, leisure activities, etc.), and trade patterns the degree of protectionism and the creation of regional trading blocks can affect availability to technology.
In the majority of studies, the following relationships were found (but are not proof of causation):[6]
- Rising GHGs: This was associated with scenarios having a growing, post-industrial economy with globalization, mostly with low government intervention and generally high levels of competition. Income equality declined within nations, but there was no clear pattern in social equity or international income equality.
- Falling GHGs: In some of these scenarios, GDP rose. Other scenarios showed economic activity limited at an ecologically sustainable level. Scenarios with falling emissions had a high level of government intervention in the economy. The majority of scenarios showed increased social equity and income equality within and among nations.
Scenarios for different degrees of mitigation efforts
Climate change mitigation scenarios are possible futures in which global warming is reduced by deliberate actions, such as a comprehensive switch to energy sources other than fossil fuels. These are actions that minimize emissions so atmospheric greenhouse gas concentrations are stabilized at levels that restrict the adverse consequences of climate change. Using these scenarios, the examination of the impacts of different carbon prices on an economy is enabled within the framework of different levels of global aspirations.[28]
A typical mitigation scenario is constructed by selecting a long-range target, such as a desired atmospheric concentration of carbon dioxide (CO2), and then fitting the actions to the target, for example by placing a cap on net global and national emissions of greenhouse gases.
An increase of global temperature by more than 2 °C has come to be the majority definition of what would constitute intolerably dangerous climate change with efforts to limit the temperature increase to 1.5 °C above pre-industrial levels per the Paris Agreement. Some climate scientists are increasingly of the opinion that the goal should be a complete restoration of the atmosphere's preindustrial condition, on the grounds that too protracted a deviation from those conditions will produce irreversible changes.
Stabilization wedges
A stabilization wedge is an action which incrementally reduces projected emissions. The name is derived from the triangular shape of the gap between reduced and unreduced emissions trajectories when graphed over time. For example, a reduction in electricity demand due to increased efficiency means that less electricity needs to be generated and thus fewer emissions need to be produced. The term originates in the Stabilization Wedge Game. As a reference unit, a stabilization wedge is equal to the following examples of mitigation initiatives: deployment of two hundred thousand 10 MW wind turbines; completely halting the deforestation and planting of 300 million hectares of trees; the increase in the average energy efficiency of all the world's buildings by 25 percent; or the installation of carbon capture and storage facilities in 800 large coal-fired power plants.[29] Pacala and Socolow proposed in their work, Stabilization Wedges, that seven wedges are required to be delivered by 2050 – at current technologies – to make a significant impact on the mitigation of climate change.[30] There are, however, sources that estimate the need for 14 wedges because Pacala and Socolow's proposal would only stabilize carbon dioxide emissions at current levels but not the atmospheric concentration, which is increasing by more than 2 ppm/year.[29] In 2011, Socolow revised their earlier estimate to nine.[31]
Target levels of CO2
Contributions to climate change, whether they cool or warm the Earth, are often described in terms of the radiative forcing or imbalance they introduce to the planet's energy budget. Now and in the future, anthropogenic carbon dioxide is believed to be the major component of this forcing, and the contribution of other components is often quantified in terms of "parts-per-million carbon dioxide equivalent" (ppm CO2e), or the increment/decrement in carbon dioxide concentrations which would create a radiative forcing of the same magnitude.
450 ppm
The BLUE scenarios in the IEA's Energy Technology Perspectives publication of 2008 describe pathways to a long-range concentration of 450 ppm. Joseph Romm has sketched how to achieve this target through the application of 14 wedges.[33]
World Energy Outlook 2008, mentioned above, also describes a "450 Policy Scenario", in which extra energy investments to 2030 amount to $9.3 trillion over the Reference Scenario. The scenario also features, after 2020, the participation of major economies such as China and India in a global cap-and-trade scheme initially operating in OECD and European Union countries. Also the less conservative 450 ppm scenario calls for extensive deployment of negative emissions, i.e. the removal of CO2 from the atmosphere. According to the International Energy Agency (IEA) and OECD, "Achieving lower concentration targets (450 ppm) depends significantly on the use of BECCS".[34]
550 ppm
This is the target advocated (as an upper bound) in the Stern Review. As approximately a doubling of CO2 levels relative to preindustrial times, it implies a temperature increase of about three degrees, according to conventional estimates of climate sensitivity. Pacala and Socolow list 15 "wedges", any 7 of which in combination should suffice to keep CO2 levels below 550 ppm.[35]
The International Energy Agency's World Energy Outlook report for 2008 describes a "Reference Scenario" for the world's energy future "which assumes no new government policies beyond those already adopted by mid-2008", and then a "550 Policy Scenario" in which further policies are adopted, a mixture of "cap-and-trade systems, sectoral agreements and national measures". In the Reference Scenario, between 2006 and 2030 the world invests $26.3 trillion in energy-supply infrastructure; in the 550 Policy Scenario, a further $4.1 trillion is spent in this period, mostly on efficiency increases which deliver fuel cost savings of over $7 trillion.[36]
Other greenhouse gases
Greenhouse gas concentrations are aggregated in terms of carbon dioxide equivalent. Some multi-gas mitigation scenarios have been modeled by Meinshausen et al.[37]
Trends and predictions
The annual "Emissions Gap Report" by UNEP stated in 2022 that it was necessary to almost halve emissions. "To get on track for limiting global warming to 1.5°C, global annual GHG emissions must be reduced by 45 per cent compared with emissions projections under policies currently in place in just eight years, and they must continue to decline rapidly after 2030, to avoid exhausting the limited remaining atmospheric carbon budget."[38]: xvi The report commented that the world should focus on broad-based economy-wide transformations and not incremental change.[38]: xvi
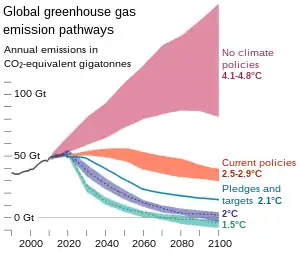
In 2022, the Intergovernmental Panel on Climate Change (IPCC) released its Sixth Assessment Report on climate change. It warned that greenhouse gas emissions must peak before 2025 at the latest and decline 43% by 2030 to have a good chance of limiting global warming to 1.5 °C (2.7 °F).[39][40] Or in the words of Secretary-General of the United Nations António Guterres: "Main emitters must drastically cut emissions starting this year".[41]Climate Action Tracker described the situation on 9 November 2021 as follows. The global temperature will rise by 2.7 °C by the end of the century with current policies and by 2.9 °C with nationally adopted policies. The temperature will rise by 2.4 °C if countries only implement the pledges for 2030. The rise would be 2.1 °C with the achievement of the long-term targets too. Full achievement of all announced targets would mean the rise in global temperature will peak at 1.9 °C and go down to 1.8 °C by the year 2100.[42] Experts gather information about climate pledges in the Global Climate Action Portal - Nazca. The scientific community is checking their fulfilment.[43]
There has not been a definitive or detailed evaluation of most goals set for 2020. But it appears the world failed to meet most or all international goals set for that year.[44][45]
One update came during the 2021 United Nations Climate Change Conference in Glasgow. The group of researchers running the Climate Action Tracker looked at countries responsible for 85% of greenhouse gas emissions. It found that only four countries or political entities – the EU, UK, Chile and Costa Rica – have published a detailed official policy‑plan that describes the steps to realise 2030 mitigation targets. These four polities are responsible for 6% of global greenhouse gas emissions.[46]
In 2021 the US and EU launched the Global Methane Pledge to cut methane emissions by 30% by 2030. The UK, Argentina, Indonesia, Italy and Mexico joined the initiative. Ghana and Iraq signaled interest in joining. A White House summary of the meeting noted those countries represent six of the top 15 methane emitters globally.[47] Israel also joined the initiative.[48]

Several organisations provide annual updates to the remaining carbon budget, including the Global Carbon Project, the Mercator Research Institute on Global Commons and Climate Change (MCC)[51] and the CONSTRAIN project.[52] In March 2022, before formal publication of the 'Global Carbon Budget 2021' preprint,[50] scientists reported, based on Carbon Monitor[53] (CM) data, that after COVID-19-pandemic-caused record-level declines in 2020, global CO2 emissions rebounded sharply by 4.8% in 2021, indicating that at the current trajectory, the carbon budget for a ⅔ likelihood for limiting warming to 1.5 °C would be used up within 9.5 years.[54]
In April 2022, the now reviewed and officially published The Global Carbon Budget 2021 concluded that fossil CO2 emissions rebounded[55] from pandemic levels by around +4.8% relative to 2020 emissions – returning to 2019 levels.
It identifies three major issues for improving reliable accuracy of monitoring, shows that China and India surpassed 2019 levels (by 5.7% and 3.2%) while the EU and the US stayed beneath 2019 levels (by 5.3% and 4.5%), quantifies various changes and trends, for the first time provides models' estimates that are linked to the official country GHG inventories reporting, and suggests that the remaining carbon budget at 1. Jan 2022 for a 50% likelihood to limit global warming to 1.5 °C (albeit a temporary exceedence is to be expected) is 120 GtC (420 GtCO2) – or 11 years of 2021 emissions levels.[50]
This does not mean that likely 11 years remain to cut emissions but that if emissions stayed the same, instead of increasing like in 2021, 11 years of constant GHG emissions would be left in the hypothetical scenario that all emissions suddenly ceased in the 12th year. (The 50% likelihood may be describable as a kind of minimum plausible deniability requirement as lower likelihoods would make the 1.5 °C goal "unlikely".) Moreover, other trackers show (or highlight) different amounts of carbon budget left, such as the MCC, which as of May 2022 shows '7 years 1 month left'[51] and different likelihoods have different carbon budgets: a 83% likelihood would mean 6.6 ±0.1 years left (ending in 2028) according to CM data.[54]
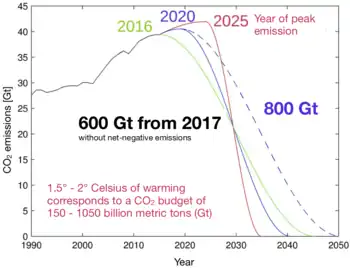
In October 2023 a group of researchers updated the carbon budget including the CO2 emitted at 2020-2022 and new findings about the role of reduced presence of polluting particles in the atmosphere.[56] They found we can emit 250 GtCO2 or 6 years of emissions at current level starting from January 2023, for having a 50% chance to stay below 1.5 degrees. For reaching this target humanity will need to zero CO2 emissions by the year 2034. To have a 50% chance of staying below 2 degrees humanity can emit 1220 GtCO2 or 30 years of emissions at current level.[57][58]Previous predictions
UNEP 2011 synthesis report
The United Nations Environment Programme (UNEP, 2011)[59]: 7 looked at how world emissions might develop out to the year 2020 depending on different policy decisions. To produce their report, UNEP (2011)[59]: 8 convened 55 scientists and experts from 28 scientific groups across 15 countries.
Projections, assuming no new efforts to reduce emissions or based on the "business-as-usual" hypothetical trend,[60] suggested global emissions in 2020 of 56 gigatonnes CO
2-equivalent (GtCO
2-eq), with a range of 55-59 GtCO
2-eq.[59]: 12 In adopting a different baseline where the pledges to the Copenhagen Accord were met in their most ambitious form, the projected global emission by 2020 will still reach the 50 gigatonnes CO
2.[61] Continuing with the current trend, particularly in the case of low-ambition form, there is an expectation of 3° Celsius temperature increase by the end of the century, which is estimated to bring severe environmental, economic, and social consequences.[62]
The report also considered the effect on emissions of policies put forward by UNFCCC Parties to address climate change. Assuming more stringent efforts to limit emissions lead to projected global emissions in 2020 of between 49 and 52 GtCO
2-eq, with a median estimate of 51 GtCO
2-eq.[59]: 12 Assuming less stringent efforts to limit emissions lead to projected global emissions in 2020 of between 53 and 57 GtCO
2-eq, with a median estimate of 55 GtCO
2-eq.[59]: 12
National climate (change) projections
National climate (change) projections (also termed "national climate scenarios" or "national climate assessments") are specialized regional climate projections, typically produced for and by individual countries. What distinguishes national climate projections from other climate projections is that they are officially signed off by the national government, thereby being the relevant national basis for adaptation planning. Climate projections are commonly produced over several years by countries' national meteorological services or academic institutions working on climate change.
Typically distributed as a single product, climate projections condense information from multiple climate models, using multiple greenhouse gas emission pathways (e.g. Representative Concentration Pathways) to characterize different yet coherent climate futures. Such a product highlights plausible climatic changes through the use of narratives, graphs, maps, and perhaps raw data. Climate projections are often publicly available for policy-makers, public and private decision makers, as well as researchers to undertake further climate impact studies, risk assessments, and climate change adaptation research. The projections are updated every few years, in order to incorporate new scientific insights and improved climate models.
National climate projections form the basis of national climate adaptation and climate resilience plans, which are reported to UNFCCC and used in IPCC assessments.
Design
To explore a wide range of plausible climatic outcomes and to enhance confidence in the projections, national climate change projections are often generated from multiple general circulation models (GCMs). Such climate ensembles can take the form of perturbed physics ensembles (PPE), multi-model ensembles (MME), or initial condition ensembles (ICE).[63] As the spatial resolution of the underlying GCMs is typically quite coarse, the projections are often downscaled, either dynamically using regional climate models (RCMs), or statistically. Some projections include data from areas which are larger than the national boundaries, e.g. to more fully evaluate catchment areas of transboundary rivers. Some countries have also produced more localized projections for smaller administrative areas, e.g. States in the United States, and Länder in Germany.
Various countries have produced their national climate projections with feedback and/or interaction with stakeholders.[64] Such engagement efforts have helped tailoring the climate information to the stakeholders' needs, including the provision of sector-specific climate indicators such as degree-heating days.
Examples
Over 30 countries have reported national climate projections / scenarios in their most recent National Communications to United Nations Framework Convention on Climate Change. Many European governments have also funded national information portals on climate change.[65]
- Australia: CCIA[66]
- California: Cal-Adapt[67]
- Netherlands: KNMI'14[68]
- Switzerland: CH2011[69] / CH2018[70]
- UK: UKCP09 / UKCP18[71][72]
For countries which lack adequate resources to develop their own climate change projections, organisations such as UNDP or FAO have sponsored development of projections and national adaptation programmes (NAPAs).[73][74]
See also
References
- ↑ USGCRP. Climate Science Special Report (Report). U.S. Global Change Research Program, Washington, DC. pp. 1–470.
- ↑ Fawcett, Allen A.; Iyer, Gokul C.; Clarke, Leon E.; Edmonds, James A.; Hultman, Nathan E.; McJeon, Haewon C.; Rogelj, Joeri; Schuler, Reed; Alsalam, Jameel; Asrar, Ghassem R.; Creason, Jared; Jeong, Minji; McFarland, James; Mundra, Anupriya; Shi, Wenjing (2015-12-04). "Can Paris pledges avert severe climate change?". Science. 350 (6265): 1168–1169. doi:10.1126/science.aad5761. ISSN 0036-8075.
- ↑ Carter, T.R.; et al. (2001). "Developing and Applying Scenarios. In: Climate Change 2001: Impacts, Adaptation and Vulnerability. Contribution of Working Group II to the Third Assessment Report of the Intergovernmental Panel on Climate Change [J.J. McCarthy et al. Eds.]". Cambridge University Press, Cambridge, U.K., and New York, N.Y., U.S.A. Archived from the original on 2018-10-05. Retrieved 2010-01-10.
- 1 2 "IPCC AR6 WG3 Ch3" (PDF). Archived from the original (PDF) on 2022-12-04. Retrieved 2022-04-05.
- ↑ Press release: Special Report on Global Warming of 1.5°C (PDF) (Report). Incheon, Republic of Korea: Intergovernmental Panel on Climate Change (IPCC). 8 October 2018. Retrieved 7 October 2018.
- 1 2 Morita, T.; et al. (2001). "Greenhouse Gas Emission Mitigation Scenarios and Implications. In: Climate Change 2001: Mitigation. Contribution of Working Group III to the Third Assessment Report of the Intergovernmental Panel on Climate Change [B. Metz et al. Eds.]". Cambridge University Press, Cambridge, U.K., and New York, N.Y., U.S.A. Archived from the original on 2018-10-05. Retrieved 2010-01-10.
- ↑ IPCC (2007c). "Annex. In: Climate Change 2007: Mitigation. Contribution of Working Group III to the Fourth Assessment Report of the Intergovernmental Panel on Climate Change [B. Metz et al. Eds.]". Cambridge University Press, Cambridge, U.K., and New York, N.Y., U.S.A. Archived from the original on 2018-10-05. Retrieved 2009-05-20.
- ↑ Fisher; et al., "Chapter 3: Issues related to mitigation in the long-term context", Archived copy, Sec. 3.1 Emissions scenarios, archived from the original on 2018-11-16, retrieved 2012-09-08
{{citation}}: CS1 maint: archived copy as title (link), in IPCC AR4 WG3 (2007) - ↑ Morita; et al., "Chapter 2, Greenhouse Gas Emission Mitigation Scenarios and Implications", Archived copy, Sec. 2.5.1.1 IPCC Emissions Scenarios and the SRES Process, archived from the original on 2013-07-06, retrieved 2012-09-08
{{citation}}: CS1 maint: archived copy as title (link), in IPCC TAR WG3 (2001). - ↑ Meinshausen, M., Nicholls, Z. R. J., Lewis, J., Gidden, M. J., Vogel, E., Freund, M., Beyerle, U., Gessner, C., Nauels, A., Bauer, N., Canadell, J. G., Daniel, J. S., John, A., Krummel, P. B., Luderer, G., Meinshausen, N., Montzka, S. A., Rayner, P. J., Reimann, S., . . . Wang, R. H. J. (2020). The shared socio-economic pathway (SSP) greenhouse gas concentrations and their extensions to 2500. Geoscientific Model Development, 13(8), 3571–3605. https://doi.org/10.5194/gmd-13-3571-2020 Archived 2023-04-16 at the Wayback Machine
- ↑ Hausfather, Zeke (2018-04-19). "Explainer: How 'Shared Socioeconomic Pathways' explore future climate change". Carbon Brief. Retrieved 2019-09-13.
- ↑ "Representative Concentration Pathways (RCPs)". IPCC. Retrieved 13 February 2019.
- ↑ Richard Moss; et al. (2008). Towards New Scenarios for Analysis of Emissions, Climate Change, Impacts, and Response Strategies (PDF). Geneva: Intergovernmental Panel on Climate Change. p. 132.
- ↑ Weyant, John; Azar, Christian; Kainuma, Mikiko; Kejun, Jiang; Nakicenovic, Nebojsa; Shukla, P.R.; La Rovere, Emilio; Yohe, Gary (April 2009). Report of 2.6 Versus 2.9 Watts/m2 RCPP Evaluation Panel (PDF). Geneva, Switzerland: IPCC Secretariat.
- 1 2 3 4 "Explainer: How 'Shared Socioeconomic Pathways' explore future climate change". Carbon Brief. 2018-04-19. Retrieved 2020-03-04.
- ↑ "Explainer: How 'Shared Socioeconomic Pathways' explore future climate change". Carbon Brief. April 19, 2018.
- ↑ "Topic 2: Future changes, risks and impacts". IPCC 5th Assessment Synthesis Report. Box 2.2, figure 1.
- ↑ "Socio-Economic Data and Scenarios".
- ↑ Meinshausen, Malte; Smith, S. J.; Calvin, K.; Daniel, J. S.; Kainuma, M. L. T.; Lamarque, J-F.; Matsumoto, K.; Montzka, S. A.; Raper, S. C. B.; Riahi, K.; Thomson, A.; Velders, G. J. M.; van Vuuren, D.P. P. (2011). "The RCP greenhouse gas concentrations and their extensions from 1765 to 2300". Climatic Change. 109 (1–2): 213–241. Bibcode:2011ClCh..109..213M. doi:10.1007/s10584-011-0156-z. ISSN 0165-0009.
- ↑ Rogner, H.-H.; et al. (2007). "Introduction. In: Climate Change 2007: Mitigation. Contribution of Working Group III to the Fourth Assessment Report of the Intergovernmental Panel on Climate Change [B. Metz et al. Eds.]". Cambridge University Press, Cambridge, U.K., and New York, N.Y., U.S.A. Archived from the original on 2018-10-05. Retrieved 2009-05-20.
- 1 2 3 Fisher, B.S.; et al. (2007). "Issues related to mitigation in the long term context. In: Climate Change 2007: Mitigation. Contribution of Working Group III to the Fourth Assessment Report of the Intergovernmental Panel on Climate Change [B. Metz et al. Eds.]". Cambridge University Press, Cambridge, U.K., and New York, N.Y., U.S.A. Archived from the original on 2018-10-05. Retrieved 2009-05-20.
- ↑ Fisher, B.S.; et al. (2007). ""3.2.1.6 Land-use change and land-use management." In [book chapter]: "Issues related to mitigation in the long term context." In [book]: "Climate Change 2007: Mitigation. Contribution of Working Group III to the Fourth Assessment Report of the Intergovernmental Panel on Climate Change [B. Metz et al. Eds.]". Print version: Cambridge University Press, Cambridge, U.K., and New York, N.Y., U.S.A.. This version: IPCC website. Archived from the original on 2010-04-25. Retrieved 2010-03-18.
- ↑ Commonwealth of Australia, "Climate Change Mitigation Scenarios: Modeling report provided to the Climate Change Authority in support of its Caps and Targets Review," 2013. Retrieved 13 December 2018 from https://www.environment.gov.au/system/files/resources/a28424ae-cce9-48c9-aad2-56b3db0920a5/files/climate-change-mitigation-scenarios.pdf
- 1 2 Dawson, Brian; Spannagle, Matt (2008). The Complete Guide to Climate Change. Oxon: Routledge. pp. 283. ISBN 978-0415477895.
- ↑ Pacala, S.; Socolow, R. (2004-08-13). "Stabilization Wedges: Solving the Climate Problem for the Next 50 Years with Current Technologies". Science. 305 (5686): 968–972. Bibcode:2004Sci...305..968P. CiteSeerX 10.1.1.642.8472. doi:10.1126/science.1100103. ISSN 0036-8075. PMID 15310891. S2CID 2203046.
- ↑ Socolow, Robert (September 27, 2011). "Wedges reaffirmed - Bulletin of the Atomic Scientists". Bulletin of the Atomic Scientists. Retrieved 2018-08-27.
- ↑ Christiana Figueres; Hans Joachim Schellnhuber; Gail Whiteman; Johan Rockström (2017-06-29). "Three years to safeguard our climate". Nature. Vol. 546, no. 7660. pp. 593–595. doi:10.1038/546593a. ISSN 0028-0836. Retrieved 2022-05-01.
- ↑ Is 450 ppm (or less) politically possible? Part 2: The Solution
- ↑ "OECD Environmental Outlook to 2050, Climate Change Chapter, pre-release version" (PDF). OECD. 2011. Retrieved 2012-01-16.
- ↑ Pacala, S.; Socolow, R. (13 August 2004). "Stabilization Wedges: Solving the Climate Problem for the Next 50 Years with Current Technologies". Science. 305 (5686): 968–972. Bibcode:2004Sci...305..968P. CiteSeerX 10.1.1.642.8472. doi:10.1126/science.1100103. PMID 15310891. S2CID 2203046.
- ↑ http://www.iea.org/weo/docs/weo2008/fact_sheets_08.pdf Archived 2008-11-17 at the Wayback Machine World Energy Outlook 2008 Fact Sheet
- ↑ Meinshausen, M.; Hare, B.; Wigley, T. M. M.; Vuuren, D.; Elzen, M. G. J.; Swart, R. (2006). "Multi-gas Emissions Pathways to Meet Climate Targets" (PDF). Climatic Change. 75 (1–2): 151. Bibcode:2006ClCh...75..151M. doi:10.1007/s10584-005-9013-2. hdl:20.500.11850/36894. S2CID 55462579.
- 1 2 United Nations Environment Programme (2022). Emissions Gap Report 2022: The Closing Window — Climate crisis calls for rapid transformation of societies. Nairobi.
- ↑ "It's over for fossil fuels: IPCC spells out what's needed to avert climate disaster". The Guardian. 4 April 2022. Retrieved 4 April 2022.
- ↑ "The evidence is clear: the time for action is now. We can halve emissions by 2030". IPCC. 4 April 2022. Retrieved 4 April 2022.
- ↑ "Ambitious Action Key to Resolving Triple Planetary Crisis of Climate Disruption, Nature Loss, Pollution, Secretary-General Says in Message for International Mother Earth Day | Meetings Coverage and Press Releases". www.un.org. Retrieved 10 June 2022.
- ↑ "Glasgow's 2030 credibility gap: net zero's lip service to climate action". climateactiontracker.org. Archived from the original on 9 November 2021. Retrieved 9 November 2021.
- ↑ "Global Data Community Commits to Track Climate Action". UNFCCC. Retrieved 15 December 2019.
- ↑ Nations, United. "Sustainable Development Goals Report 2020". United Nations. Retrieved 20 December 2021.
- ↑ "World fails to meet a single target to stop destruction of nature – UN report". The Guardian. 15 September 2020. Retrieved 20 December 2021.
- ↑ "Glasgow's 2030 credibility gap: net zero's lip service to climate action". climateactiontracker.org. Retrieved 9 November 2021.
- ↑ Mason, Jeff; Alper, Alexandra (18 September 2021). "Biden asks world leaders to cut methane in climate fight". Reuters. Retrieved 8 October 2021.
- ↑ Bassist, Rina (6 October 2021). "At OECD, Israel joins global battle against climate change". Al – Monitor.
- ↑ "Global Carbon Budget 2021" (PDF). Global Carbon Project. 4 November 2021. p. 57. Archived (PDF) from the original on 11 December 2021.
The cumulative contributions to the global carbon budget from 1850. The carbon imbalance represents the gap in our current understanding of sources & sinks. ... Source: Friedlingstein et al 2021; Global Carbon Project 2021
- 1 2 3 Friedlingstein, Pierre; Jones, Matthew W.; O'Sullivan, Michael; et al. (26 April 2022). "Global Carbon Budget 2021". Earth System Science Data. 14 (4): 1917–2005. Bibcode:2022ESSD...14.1917F. doi:10.5194/essd-14-1917-2022. hdl:20.500.11850/545754. ISSN 1866-3508.
- News report: "Cut emissions "starting now" – Global Carbon Project experts". University of Exeter. Archived from the original on 12 May 2022. Retrieved 12 May 2022.
- 1 2 "Remaining carbon budget - Mercator Research Institute on Global Commons and Climate Change (MCC)". www.mcc-berlin.net. Retrieved 27 April 2022.
- ↑ "Publications | Reports Archives". Constrain. Retrieved 2023-09-20.
- ↑ "Carbon monitor". carbonmonitor.org. Retrieved 19 April 2022.
- 1 2 Liu, Zhu; Deng, Zhu; Davis, Steven J.; Giron, Clement; Ciais, Philippe (April 2022). "Monitoring global carbon emissions in 2021". Nature Reviews Earth & Environment. 3 (4): 217–219. Bibcode:2022NRvEE...3..217L. doi:10.1038/s43017-022-00285-w. ISSN 2662-138X. PMC 8935618. PMID 35340723.
- ↑ Jackson, R B; Friedlingstein, P; Le Quéré, C; Abernethy, S; Andrew, R M; Canadell, J G; Ciais, P; Davis, S J; Deng, Zhu; Liu, Zhu; Korsbakken, J I; Peters, G P (1 March 2022). "Global fossil carbon emissions rebound near pre-COVID-19 levels". Environmental Research Letters. 17 (3): 031001. arXiv:2111.02222. Bibcode:2022ERL....17c1001J. doi:10.1088/1748-9326/ac55b6. S2CID 241035429.
- ↑ Lamboll, Robin D.; Nicholls, Zebedee R. J.; Smith, Christopher J.; Kikstra, Jarmo S.; Byers, Edward; Rogelj, Joeri (December 2023). "Assessing the size and uncertainty of remaining carbon budgets". Nature Climate Change. 13 (12): 1360–1367. doi:10.1038/s41558-023-01848-5.
- ↑ McGrath, Matt (31 October 2023). "Carbon emissions threaten 1.5C climate threshold sooner than thought - report". Nature Climate Change. BBC. Retrieved 1 November 2023.
- ↑ BORENSTEIN, SETH (30 October 2023). "Earth Will Lock in 1.5°C of Warming By 2029 At Current Rate of Burning Fossil Fuels". Times. Retrieved 1 November 2023.
- 1 2 3 4 5 UNEP (November 2011), Bridging the Emissions Gap: A UNEP Synthesis Report (PDF), Nairobi, Kenya: United Nations Environment Programme (UNEP), ISBN 978-92-807-3229-0, archived from the original (PDF) on 2011-11-26, retrieved 2012-09-08 UNEP Stock Number: DEW/1470/NA
- ↑ Fozzard, Adrian (2014). Climate Change Public Expenditure and Institutional Review Sourcebook (CCPEIR). Washington, D.C.: World Bank Publications. p. 92.
- ↑ Alam, Shawkat; Bhuiyan, Jahid; Chowdhury, Tareq; Techera, Erika (2013). Routledge Handbook of International Environmental Law. London: Routledge. p. 373. ISBN 9780415687171.
- ↑ Govaere, Inge; Poli, Sara (2014). EU Management of Global Emergencies: Legal Framework for Combating Threats and Crises. Leiden: BRILL Nijhoff. p. 313. ISBN 9789004268326.
- ↑ Parker, Wendy S. (2012). "Whose Probabilities? Predicting Climate Change with Ensembles of Models". Philosophy of Science. 77 (5): 985–997. doi:10.1086/656815. ISSN 0031-8248. S2CID 121314681.
- ↑ Skelton, Maurice; Porter, James J.; Dessai, Suraje; Bresch, David N.; Knutti, Reto (2017-04-26). "The social and scientific values that shape national climate scenarios: a comparison of the Netherlands, Switzerland and the UK". Regional Environmental Change. 17 (8): 2325–2338. doi:10.1007/s10113-017-1155-z. ISSN 1436-3798. PMC 6959399. PMID 32009852.
- ↑
Füssel, Hans-Martin (2014). How Is Uncertainty Addressed in the Knowledge Base for National Adaptation Planning?. In Adapting to an Uncertain Climate. pp. 41-66: Springer, Cham. ISBN 978-3-319-04875-8.
{{cite book}}: CS1 maint: location (link) - ↑ Climate Change in Australia
- ↑ California climate change scenarios and climate impact research
- ↑ KNMI'14 Pictures of the future - Climate scenarios
- ↑ "Swiss Climate Change Scenarios CH2011 B". ch2011.ch. Retrieved 2018-08-23.
- ↑ CH2018 - New Climate Scenarios for Switzerland
- ↑ UKCP18 Project announcement
- ↑ UKCP18 Demonstration Projects (Met Office)
- ↑ UNDP - Supporting Integrated Climate Change Strategies
- ↑ UNFCCC - National Adaptation Programmes of Action - Introduction
External links
- UNDP Climate Change Country Profiles - Introduction;UNDP Climate Change Country Profiles (61 countries)
| |||||||||||||
| |||||||||||||
| |||||||||||||
| |||||||||||||
| |||||||||||||
| |||||||||||||
| |||||||||||||
| |||||||||||||
| Models | |
|---|---|
| Open data | |
| Lists | |
| Concepts | |
| Applications | |
| People | |
| Organizations | |
| |